IFVG Trading Explained: Inverse (Inversion) Fair Value Gap Strategy
IFVG meaning and trading rules, with real BTC charts showing a close through, a retest, and a failed inverse fair value gap.

An inverse fair value gap (also called inversion fair value gap, or IFVG) describes a change in how price interacts with a previously marked gap. Below, two real BTC examples show the difference between recognizing that change and assuming it will produce a winning trade.
Start with the basics of fair value gaps, then distinguish the original gap from its later inversion. Record the timeframe, boundaries, and confirmation rule before evaluating a retest.
What Does IFVG Terminology Mean?
Before going further: the acronym IFVG is used in two common phrasings across the trading community:
- Inverse Fair Value Gap
- Inversion Fair Value Gap
Both terms refer to the exact same price structure. This post uses them interchangeably. If you see either term online, it is the same concept.
What Is an Inverse FVG?
An inverse FVG forms when a standard fair value gap gets completely filled and price continues through it in the opposite direction. The gap's original purpose is negated, and the zone flips. This is one of several distinct FVG types that carry different trading implications.
Formation Sequence
Bullish FVG → Bearish Inverse FVG:
- A bullish FVG forms (price gaps up, leaving demand below)
- Price drops back down to the gap (normal retest)
- Instead of bouncing, price fills the entire gap AND closes below it
- The bullish gap is now inverted - it becomes a bearish zone
- On a later rally, traders watch whether the zone acts as resistance
Bearish FVG → Bullish Inverse FVG:
- A bearish FVG forms (price gaps down, leaving supply above)
- Price rallies back up to the gap (normal retest)
- Instead of rejecting, price fills the entire gap AND closes above it
- The bearish gap is now inverted - it becomes a bullish zone
- On a later decline, traders watch whether the zone acts as support
What Does an IFVG Look Like on a Real Chart?
These examples use Binance BTCUSDT perpetual futures, 30-minute candles, on July 17, 2026. All times are UTC candle-open times. A 14:00 candle's close is only known at 14:30. They were selected retrospectively to explain the rules, not to estimate a win rate or demonstrate an indicator's signals.
A close through the gap, followed by a retest
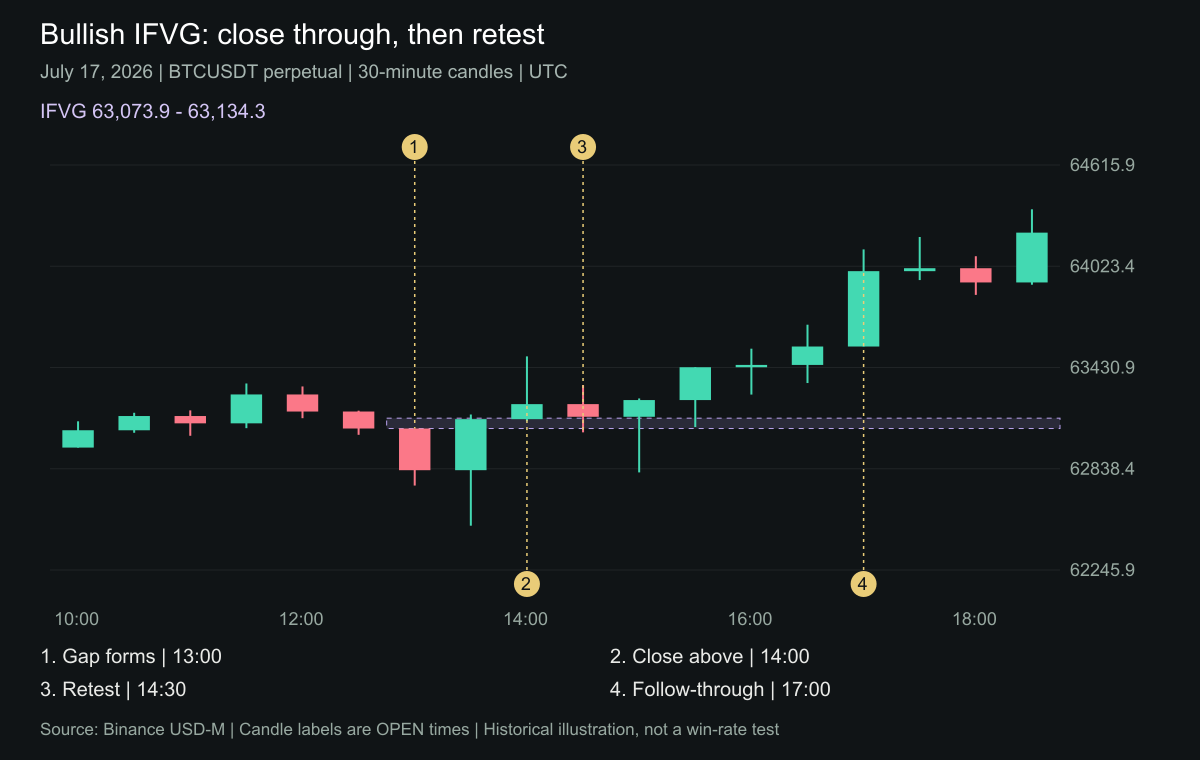
| Stage | Candle opens (UTC) | What the completed candle shows |
|---|---|---|
| Original bearish FVG | 13:00 | The three-candle gap is 63,073.9 to 63,134.3. |
| Wick through only | 13:30 | High 63,155.8, but close 63,128.6 remains below the upper boundary. No confirmed bullish inversion yet. |
| Inversion | 14:00 | Close 63,216.5 is above the full gap. Confirmation is available at 14:30. |
| Retest | 14:30 | Low 63,051.4 passes below the zone, but close 63,142.5 returns above it. |
The later rise does not mean every stop placement survived. The retest wick crossed the lower boundary, and the next candle reached 62,817.0. A stop just below the gap could have been hit even though the chart later rose. Define wick-based trade risk separately from a close-based pattern rule.
An earlier inversion that failed
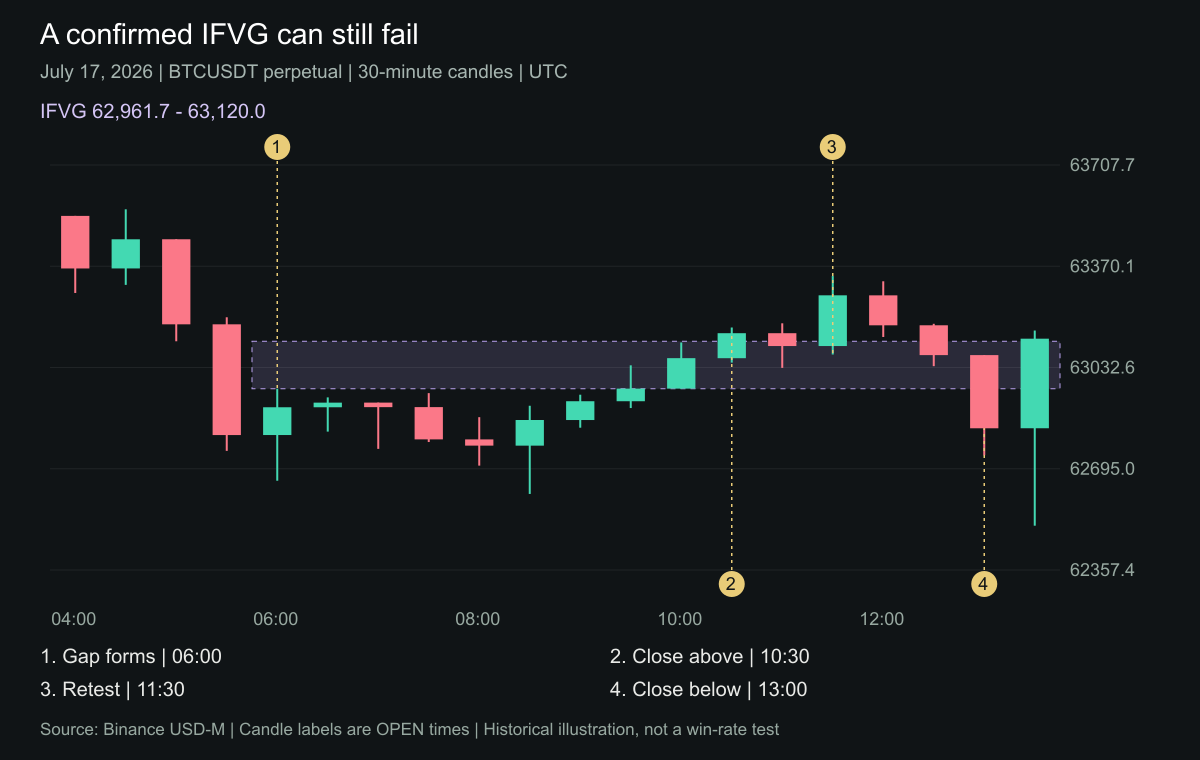
Earlier that day, a different bearish FVG spanned 62,961.7 to 63,120.0. The 10:30 candle closed at 63,146.9, confirming a bullish inversion. The 11:30 candle revisited the zone and closed above it, but the 13:00 candle later closed at 62,829.9, below the entire zone. That invalidated the bullish IFVG under this guide's close-based rule.
A valid formation and retest are not the same thing as a durable trend change. Compare the gap flip with a separate market structure shift rather than treating the two labels as interchangeable. Source: Binance historical candle API.
Why Do Traders Watch Inverse FVGs?
1. A Defined Change at the Gap
An inversion distinguishes a completed close through the gap from a wick that returns inside it. That is an observable event with a price level and timestamp.
This confirms a close through the marked gap, not the identity or intentions of the traders involved. A separate swing break is needed to identify a market structure shift.
2. Trapped Traders
One interpretation is that traders positioned for the original gap to hold may exit on a return to that level. Candles cannot establish those positions, their exits, or whether they make the zone more effective. Treat this as a hypothesis, not a confirmation criterion.
3. Clear Invalidation
The gap boundaries make a close-based invalidation rule easy to record. That pattern rule is separate from the placement and execution of a stop order, as the first chart demonstrates.
4. Typically at Key Levels
Record whether an inversion occurs near a session high or low, a liquidity sweep, or a structural break. Those context tags can be tested; their presence alone does not establish an edge.
How to Trade Inverse FVGs
Step 1: Identify the Original FVG
Watch for standard FVGs forming at structural levels. Mark them and monitor.
Step 2: Watch for the Inversion
When price returns to the FVG, observe closely:
- Does price bounce at the gap (normal retest) → FVG held, trade the bounce
- Does price fill the gap and close through (inversion) → Mark the inverse FVG
The close through is critical. A wick through that closes back inside is not an inversion.
Step 3: Wait for the Retest
After inversion, wait for price to return to the inverse FVG zone. This is your entry.
Step 4: Enter With Confirmation
At the inverse FVG zone, look for:
- Reversal candlestick pattern
- Lower timeframe structure shift
- Volume spike
- Another FVG forming at the zone
Step 5: Define Risk
Stop-loss: Beyond the inverse FVG boundary. If price closes back through, the inversion has failed.
Take-profit:
- TP1: The next structural level or opposing zone
- TP2: The level that the original FVG launched from
- TP3: The next liquidity target
How Can a Liquidity Sweep Add Context to an IFVG?
A commonly used sequence to test is:
- Price sweeps a key liquidity level (PDH/PDL, session H/L, obvious swing point)
- The sweep creates or inverts an existing FVG
- The inverse FVG forms right at the sweep level
- Price pulls back to the iFVG zone
- You enter in the reversal direction with stop beyond the sweep wick
This setup combines:
- Institutional liquidity sweep (positioning event)
- Confirmed FVG inversion (directional shift)
- Clear entry zone (the inverse gap)
- Clear invalidation (beyond the sweep)
GrandAlgo
See these concepts automated on your charts
18 TradingView indicators — smart money, price action, supply/demand, and more.
Inverse FVGs Across Timeframes
Timeframes change the candle duration and the context being reviewed:
- Daily iFVG - Daily closes and multi-day context.
- 4H iFVG - Four-hour closes and swing context.
- 1H iFVG - Hourly closes and intraday context.
- 15m iFVG - Fifteen-minute closes and shorter-term context.
A higher-timeframe gap and a lower-timeframe entry rule can be combined, but their results need to be tested together. A larger timeframe is not a guarantee of a more reliable trade.
When Inverse FVGs Fail
They're not infallible:
- In strong trends, an inversion might be temporary - the trend can reassert itself
- Lower timeframes create different signal counts and cost sensitivity; compare their results rather than assuming equal performance
- Without structural confirmation, an iFVG is less meaningful - check that market structure supports the reversal direction, such as a confirmed Change of Character
- Old inversions lose relevance as market context changes
Risk Management
A close-based invalidation rule is not a stop order. A broker stop can trigger on a wick before the candle closes, and a fill may differ from the requested price. Record the stop rule, spread, fees, and slippage when testing. The Smarter Money Suite can help mark chart structures; detection alone does not establish a profitable trade.
How Is IFVG Trading Different From Regular FVG Trading?
Understanding the difference between IFVG trading and regular FVG trading is critical — they are not the same game.
A regular FVG trade assumes the gap will hold on retest. You enter when price revisits the unfilled FVG, expecting it to act as support (for bullish gaps) or resistance (for bearish gaps). The FVG is treated as an area of institutional interest that should still be active.
An IFVG trade assumes the gap has already failed and inverted. You enter at the former FVG's level, expecting it to now act as the opposite — a failed bullish FVG now acting as resistance, or a failed bearish FVG now acting as support. The setup only works because the original gap has been invalidated.
The assumed direction is opposite, and the entry timing is different: this IFVG definition requires a confirmed close through, not just a wick. Neither setup proves the intentions of traders at the original gap.
Keep the two definitions separate in your records. A losing trade can still satisfy its setup rules; relabeling it afterward makes the test unreliable.
What IFVG Trading Rules Matter Most?
Use these as explicit rules for a testable setup, not as a promise of profitability.
Rule 1: Wait for the Close Through, Not the Wick Through
A wick that pokes through an FVG and closes back inside is not an inversion. It is just a liquidity sweep or a failed retest. The FVG is still active in its original direction.
An inversion requires the candle body to close on the opposite side of the FVG. On smaller timeframes this distinction is subtle, and on faster instruments (crypto, small caps) it is easy to see a wick-through, call it an inversion, and enter against the real direction.
The confirmation should come on your primary timeframe. If you are trading 15-minute IFVGs, wait for a 15-minute candle to close through — not a 5-minute candle's wick.
Rule 2: The IFVG Level Must Be Retested
The inversion itself is not the entry. The entry is the retest of the former FVG level after inversion.
Entering on the inversion candle is a different strategy from waiting for a retest. Price may return later, continue without a retest, or reverse immediately. Compare those entry rules separately instead of assuming a fixed number of candles before the return.
For a retest-based plan, a setup without a retest is a skipped trade. Record the entry and stop rules in advance; a tight stop can be hit even when price later moves in the anticipated direction.
Rule 3: Record the Higher-Timeframe Context
An inversion on a 15-minute chart can occur while a four-hour gap remains intact. Those observations describe different candle sequences and are not inherently contradictory.
Decide how your rules handle that conflict before entry. Requiring alignment is a filter to evaluate, not proof that the higher timeframe always wins.
Always check at least one higher timeframe before taking an IFVG trade.
What IFVG Trading Mistakes Should You Avoid?
These errors make a setup harder to evaluate consistently. Avoiding them does not eliminate losing trades:
Treating wicks as inversions. Already covered under Rule 1, but it is so common it deserves repeating. A wick through is not a close through. Train your eye to see the difference.
Ignoring context. Record the trend, nearby swing levels, and any change of character or liquidity sweep. Compare results with and without each filter.
Changing entry rules mid-trade. An immediate entry does not satisfy a retest-based plan. Treat it as a separate setup instead of changing the definition when price moves quickly.
Using an arbitrary signal count. There is no universal daily quota. Frequency depends on the instrument, timeframe, gap definition, and filters. Audit the candles against those rules instead of rejecting a setup because it is the third that day.
Combining unlike gaps in one test. Tag consolidation and displacement contexts, as well as the type of fair value gap, so a result can be traced to a consistent definition.
Frequently Asked Questions
Yes. IFVG can mean inverse fair value gap or inversion fair value gap. Both terms describe the same structure: a fair value gap that fails, gets traded through, and then acts from the opposite side as a reversal or continuation level.
Frequency depends on the instrument, timeframe, gap definition, and filters. There is no universal daily or weekly count. Count formations using the same close-through rule over a defined sample, and distinguish all confirmed inversions from the smaller subset that also meets your retest-entry conditions.
There is no universal best timeframe. Choose a timeframe that matches the holding period you are testing, and compare results after spreads, fees, and slippage. A higher timeframe does not guarantee a better result. Keep its confirmation candle separate from any lower-timeframe entry trigger.
The pattern can be identified in OHLC charts across those markets. Pattern detection does not establish profitability. Session gaps, liquidity, contract specifications, and execution costs require market-specific testing. The BTC perpetual examples in this article do not validate a forex or stock strategy.
This guide does not establish a win rate. The examples were selected retrospectively to explain formation and failure. Estimate performance with a defined entry, stop, target, and cost model across an independent sample, including failed setups. Report the sample size and test period alongside any result.
The Short Version
- An inverse FVG forms when a gap is completely filled and price continues through the opposite side
- This guide confirms inversion with a close beyond the full gap; a wick alone does not qualify
- An inversion does not establish a market structure shift or identify traders' positions
- Liquidity sweeps can provide context, but the IFVG must still be tested with a defined entry and risk rule
- Timeframe alignment is a filter to test, not a guarantee of reliability
- Close-based pattern invalidation and broker stop execution are different
- Wait for the retest of the inverse zone - don't enter on the inversion itself
- Evaluate any extra confirmation rule against an independent sample after costs


