Market Structure Shift (MSS) Trading: Complete ICT/SMC Guide
Market structure shift (MSS) explained — how it differs from CHOCH, the displacement requirement, entry rules, and how to trade MSS reversals in ICT.

A Market Structure Shift (MSS) is a break against the preceding price structure with displacement. It can suggest a change in direction, but a confirmed break can still reverse. The worked charts below distinguish the swing level, the confirming candle close, and what happened afterward.
Most retail traders confuse MSS with Change of Character (CHOCH) and even with Break of Structure (BOS). They are related, but not identical. The difference is what protects your capital.
What Is a Market Structure Shift?
An MSS is a structural break against the prevailing trend that occurs with displacement. That word — displacement — is what makes MSS specific.
- Pullback: price drops into a zone and bounces. Structure intact.
- CHOCH: price breaks the most recent opposing swing. First warning of reversal.
- MSS: price breaks that swing with a strong, impulsive move that often leaves behind a fair value gap or order block.
Under the terminology used here, an MSS is a CHOCH with displacement. Definitions differ between traders, so use a consistent rule in your chart review. A candle pattern does not identify who placed the orders.
What Are the Three MSS Criteria?
For a clean MSS you want all three conditions met:
- Structural break — price takes out the most recent opposing swing high or low
- Displacement — the breaking candle (or small cluster of candles) is visibly larger than the recent average range, showing aggressive order flow
- Imbalance left behind — an FVG, a strong order block, or both, created by the displacement move
If the break is slow and overlapping, it is a CHOCH but not a true MSS. That distinction matters: slow breaks are far more likely to fail and retrace into the original trend.
What Is a Bullish MSS?
- Market has been making lower highs and lower lows (bearish structure)
- Price sweeps a key low or reaches a demand zone
- A large bullish candle — or a tight cluster of them — rips up through the most recent lower high
- The impulse move leaves a bullish FVG and/or a bullish order block at its origin
- The MSS is confirmed at the close of the breaking candle
This is a bullish structural observation, not proof that institutions have finished accumulating.
What Is a Bearish MSS?
- Market has been making higher highs and higher lows (bullish structure)
- Price runs into liquidity above a swing high or reaches a supply zone
- A large bearish candle — or a tight cluster of them — breaks below the most recent higher low
- The impulse move leaves a bearish FVG and/or a bearish order block at its origin
- The MSS is confirmed at the close of the breaking candle
This is a bearish structural observation, not proof that institutional distribution is complete.
How Do You Confirm MSS on a Real Chart?
These Binance BTCUSDT perpetual examples use 30-minute candles on July 1, 2026. Times are UTC candle opens; the final close becomes known 30 minutes later. For these examples, a swing has two lower highs or higher lows on each side, so its identification also requires the two following candles to finish. The charts are retrospective teaching examples, not GrandAlgo indicator signals or a backtest.
Bullish: mark the lower high before the break
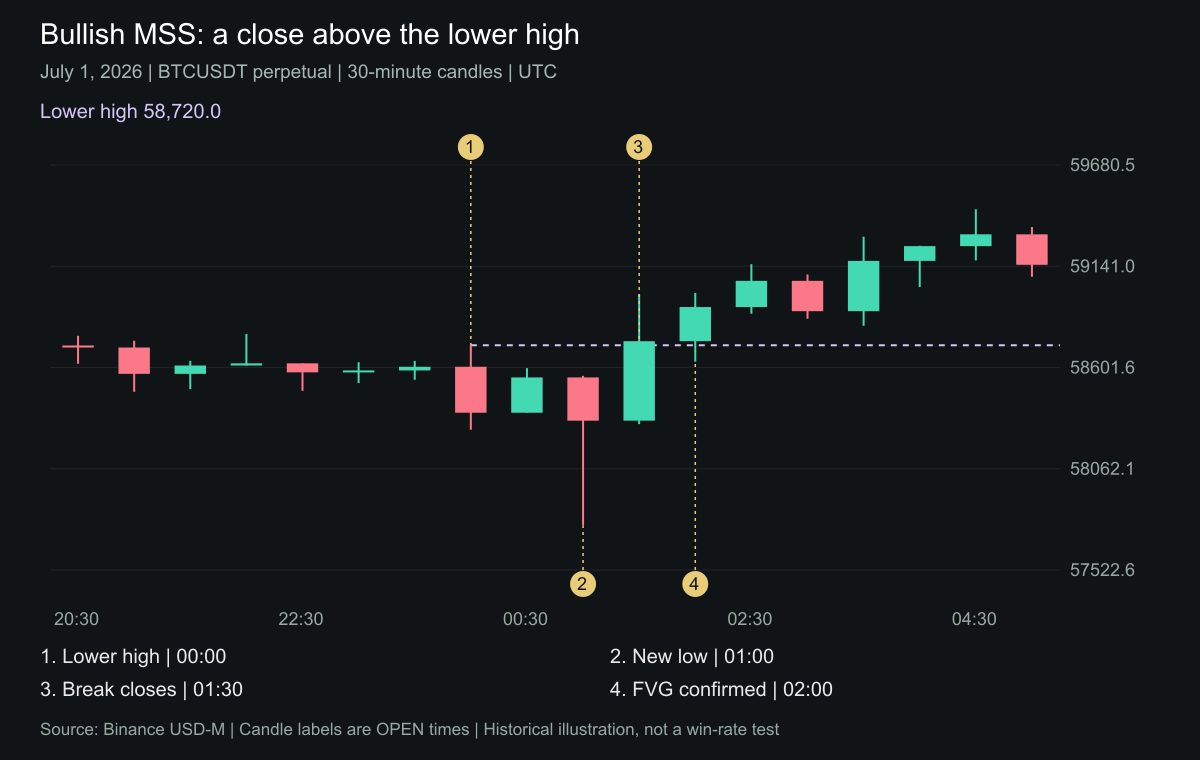
- Reference swing: the 00:00 candle's high was 58,720.0, below the previous swing high at 58,780.0. It was only confirmed as a swing after the 01:00 candle finished.
- New low: the 01:00 candle reached 57,758.6, then closed at 58,318.2. The wick alone did not confirm a bullish shift.
- Close through: the 01:30 candle closed at 58,741.7, above 58,720.0. Its 423.4-point body was larger than the 94.78-point mean body of the preceding ten candles. The break was confirmed at 02:00 UTC, not at 01:30.
- Subsequent imbalance: once the 02:00 candle finished, a bullish FVG was visible between 58,557.1 and 58,632.4. That extra confirmation was available at 02:30 UTC; it was not known at the earlier MSS close.
Bearish: a confirmed shift can later reverse
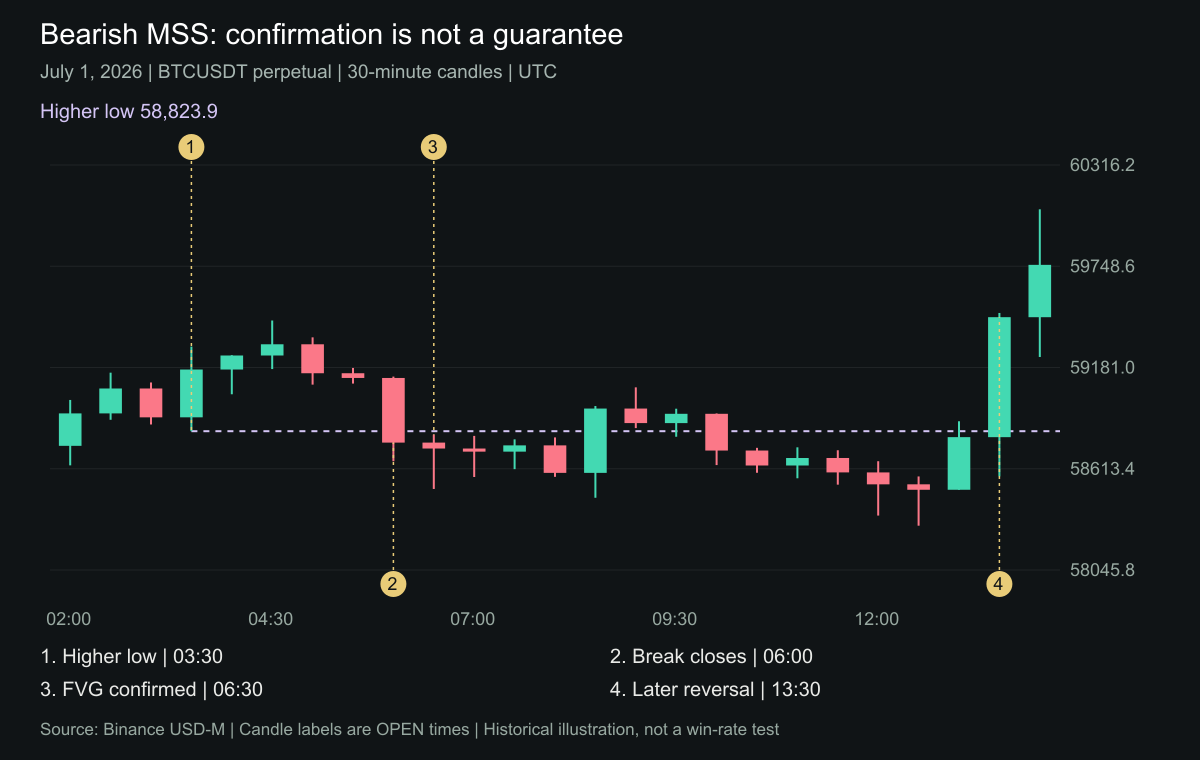
The 03:30 candle marked a higher low at 58,823.9. After a higher high at 04:30, the 06:00 candle closed at 58,759.9, confirming the bearish break at 06:30 UTC. The following candle completed a bearish FVG between 58,804.8 and 59,090.9.
Price initially moved lower, but the 13:30 candle eventually closed at 59,463.1, above the earlier swing high of 59,444.5. The structural label did not promise a lasting downtrend. Nor does this chart alone prove a winning or losing trade: that depends on entry, stop, target, and costs. A wick beyond the swing that closes back inside would fail the initial close-based confirmation rule.
Source: Binance historical candle API. To distinguish a gap flip from a swing break, see the separate IFVG examples, including a failed inversion.
GrandAlgo
See these concepts automated on your charts
18 TradingView indicators — smart money, price action, supply/demand, and more.
How Is MSS Different From CHOCH?
| Feature | CHOCH | MSS |
|---|---|---|
| Structure break | Required | Required |
| Displacement candle | Not required | Required |
| FVG or OB at break | Nice to have | Usually present |
| Follow-through guaranteed? | No | No |
| Use case | Early warning | Entry trigger |
Adding a displacement requirement changes which breaks qualify. Whether that filter improves results must be measured on the instrument and timeframe being traded; this comparison does not establish a win-rate advantage.
How Do You Trade an MSS?
Step 1: Identify the Context
MSS works best at the edges of established structure — a swept liquidity pool, a higher-timeframe supply or demand zone, or the end of an extended impulse. Random MSS signals in the middle of consolidation are low quality.
Step 2: Mark the MSS Origin
Once the displacement candle closes and the break is confirmed, locate:
- The FVG left behind by the impulse move
- The last opposing candle before the impulse (this is the order block)
These are your entry zones.
Step 3: Wait for the Retracement
Institutions rarely give you the first impulse as an entry. Price typically pulls back into the FVG or order block before continuing in the MSS direction. Enter on that retracement, not the break itself.
Step 4: Stop Placement
Place your stop beyond the swept liquidity level or below the order block that created the MSS. A tight stop inside the displacement range will get taken out on normal retest volatility.
Step 5: Target
Target the next structural level in the MSS direction — the previous swing high after a bullish MSS, or the previous swing low after a bearish MSS. Lock in partials at 1R and let the balance run.
What Common MSS Mistakes Should You Avoid?
- Calling every break an MSS. If the break is slow and the candle body is small, it is a CHOCH. Wait for displacement.
- Ignoring the higher timeframe. A bullish MSS on the 5-minute chart inside a strong bearish daily trend usually fails. Always check the HTF bias.
- Entering at the break itself. The break is the signal, not the entry. Let price retrace into the imbalance.
- Tight stops inside the displacement range. MSS entries need room. A stop right at the break level will almost always get hit on retest wicks.
- Forcing an MSS during consolidation. In ranges, every small swing looks like a break. MSS is only meaningful after a clear directional structure has formed.
What Confluence Strengthens an MSS?
- Liquidity sweep before the break — stops got taken, institutions filled, then the shift
- HTF supply or demand zone at the origin
- Session timing — MSS during the London or New York open is higher conviction than MSS during Asia
- Volume spike on the displacement candle
- FVG + order block stacked at the same level
Frequently Asked Questions
A market structure shift is a structural break that suggests control may be changing from one side of the market to the other. It is stronger when displacement and context support the break.
They are related, but not identical. CHOCH is often the first warning that character changed, while MSS usually implies a more confirmed structural shift with displacement and tradeable context.
Identify the context, mark the origin of the shift, wait for a retracement to the origin zone or imbalance, then enter with stops beyond the invalidation level.
Confirmation can include a body close through structure, displacement, a fair value gap, liquidity sweep, higher-timeframe alignment, and follow-through after the break.
The biggest mistake is labeling every minor break as a shift. A useful MSS should break meaningful structure and align with a broader trading narrative.
What Are the Key Takeaways for Market Structure Shifts?
- MSS = structural break + displacement + imbalance left behind
- It is stricter than the CHOCH definition used here, but still needs validation
- Always trade the retracement into the FVG or order block, not the break itself
- Record higher-timeframe alignment and test whether that filter improves results
- Best at liquidity sweeps, HTF zones, and session opens
- Reversal Market Structure automates this detection — it flags the displacement, marks the FVG, and plots the signal so you do not have to eyeball every candle


