Liquidity Toolkit
See where the liquidity sits before price reaches it. Supply & demand pressure clouds, liquidity heatmaps, and reaction zones that map out where institutional orders are stacked.
3 indicators in this category
 Liquidity Toolkit
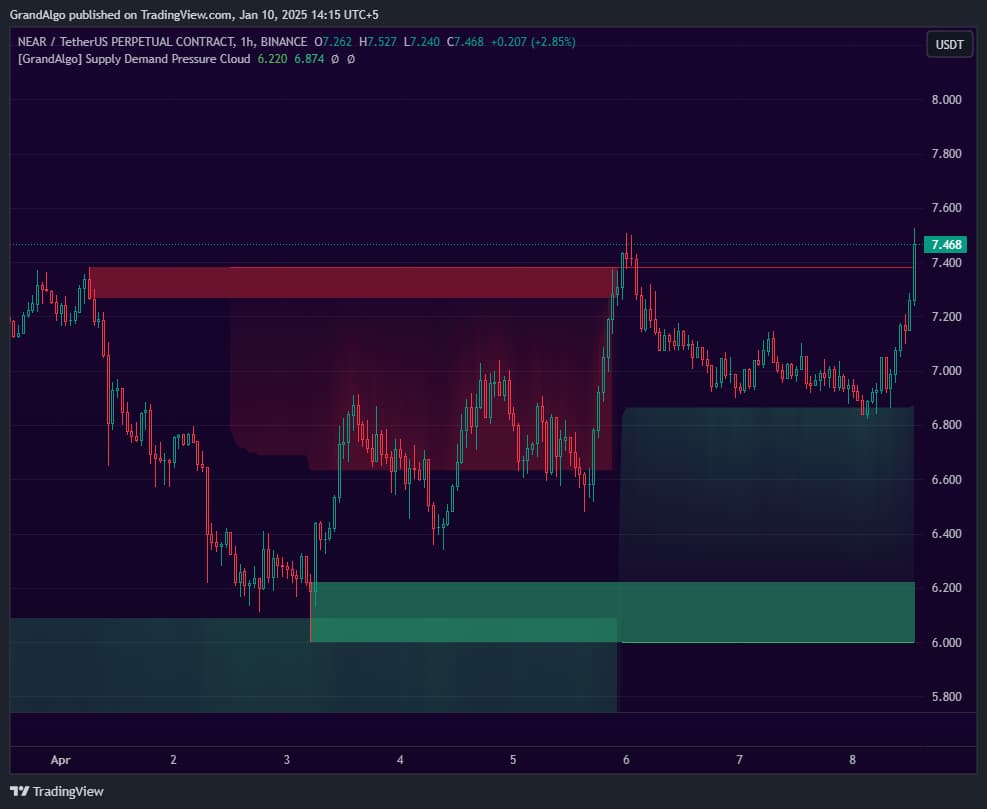
Supply Demand Pressure Cloud
Identifies supply and demand zones from structural breaks and extends gradient-shaded pressure clouds showing how far each zone's influence reaches.
 Liquidity Toolkit
Liquidity Heatmap
Creates a visual heatmap showing where the highest liquidity concentrations exist across price levels, with multi-timeframe analysis.
 Liquidity Toolkit
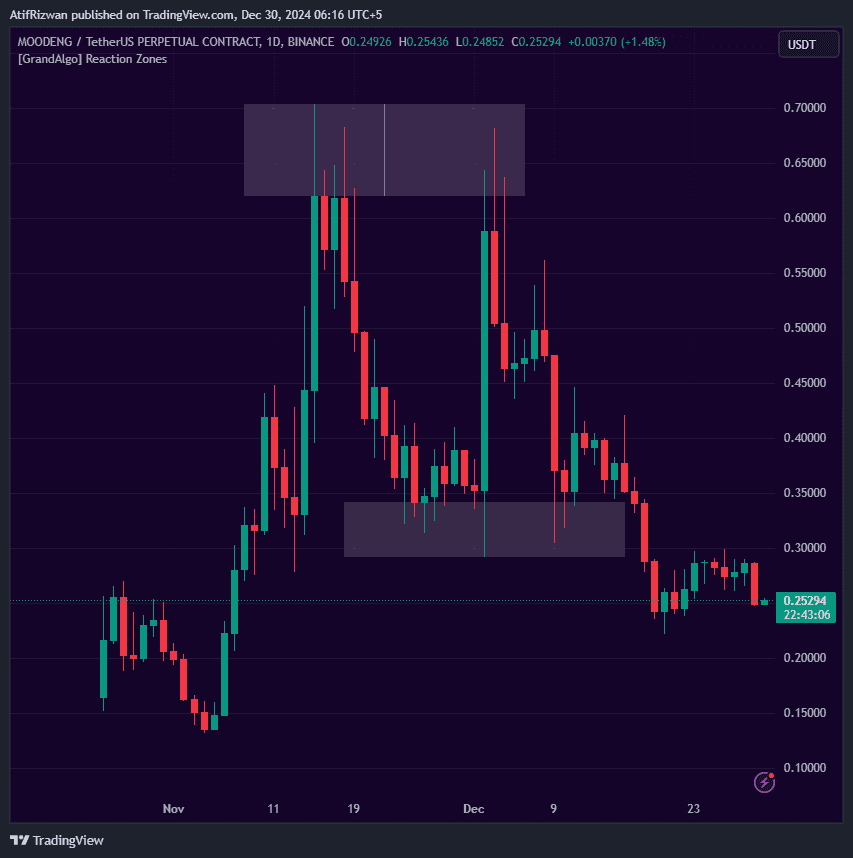
Reaction Zones
Identifies price zones where multiple historical touches have occurred, highlighting areas of high price sensitivity based on proven reaction counts.