Candle Trap Zone: Complete Setup Guide
This guide covers how to configure, interpret, and trade with the Candle Trap Zone indicator. You will learn how the detection range and strength threshold affect which zones appear, how the Fibonacci cloud extensions project influence areas, and when to trust a trap zone as a reversal signal.
What It Does
By the end you should be able to tune sensitivity for your timeframe, read the difference between strong and weak trap zones, and combine them with trend context to filter only the highest-probability setups.
Key Features
Trapped Candle Analysis
Analyzes how many candles are trapped within a reference candle's range -zones form only when the trapped ratio exceeds your configurable strength threshold.
Cloud Extensions
Projects semi-transparent cloud areas above and below each zone, extending the zone's visual influence area for wider context.
Proximity & Auto-Adjust
Prevents overlapping zones when new ones form near existing zones, or optionally expands the existing zone to encompass both.
Touch Detection & Alerts
Detects price touching zone boundaries and extension lines with optional visual markers and multiple alert types.
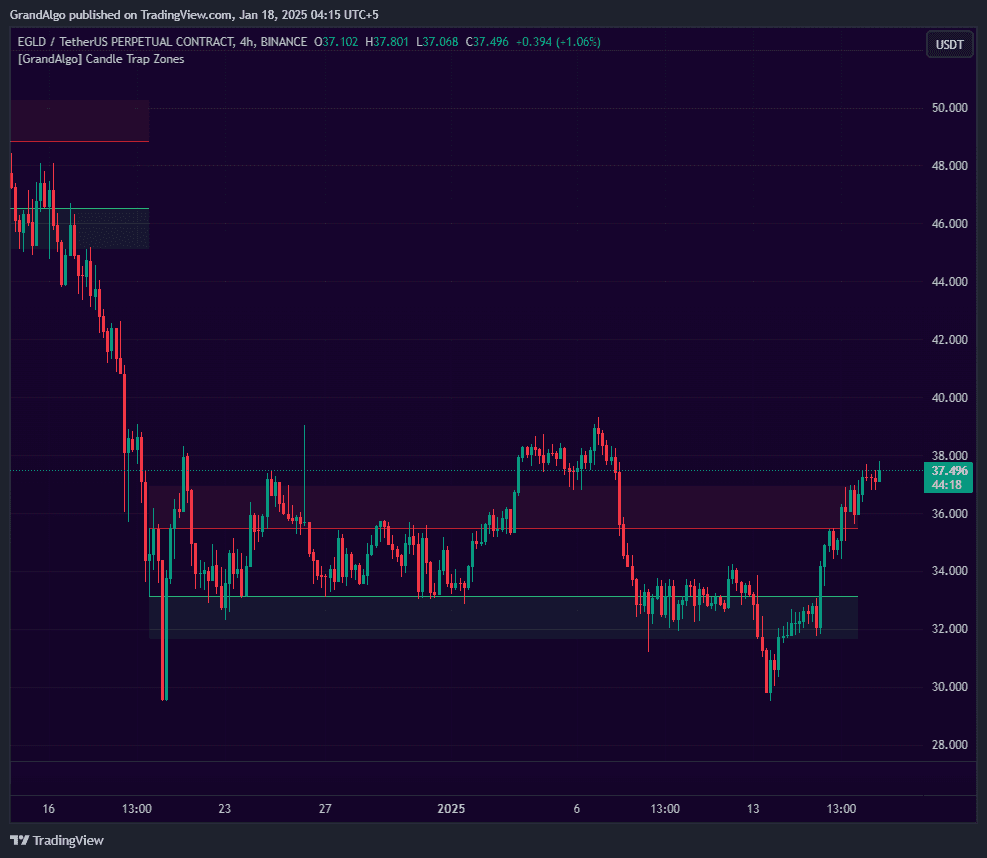
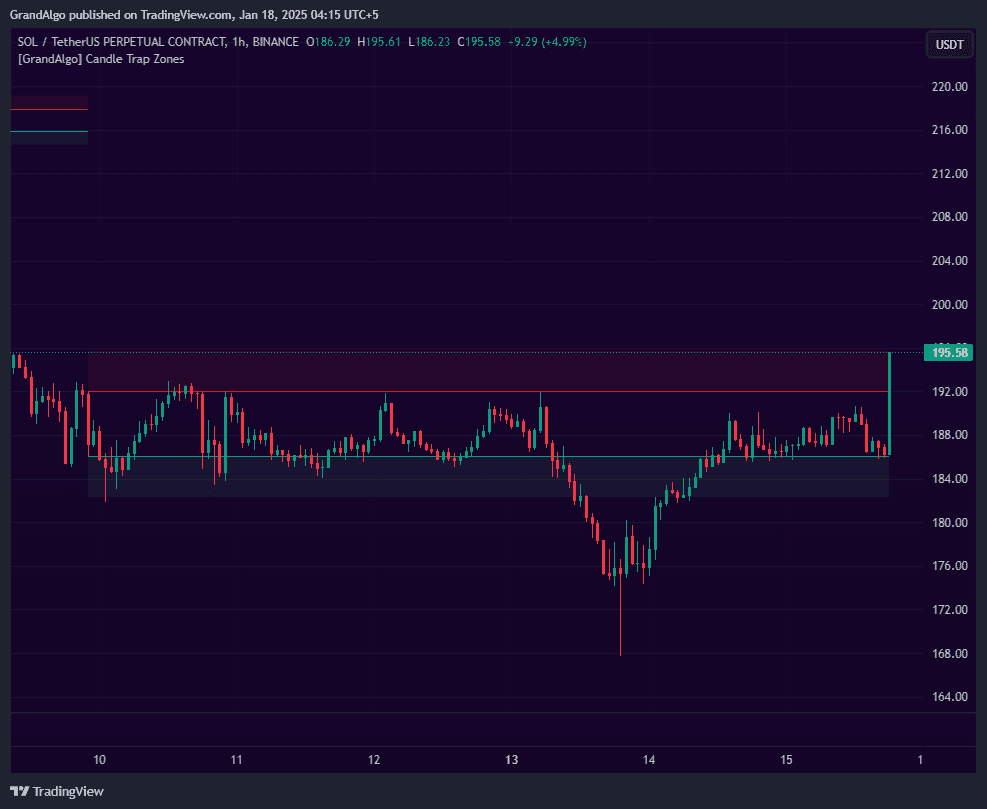
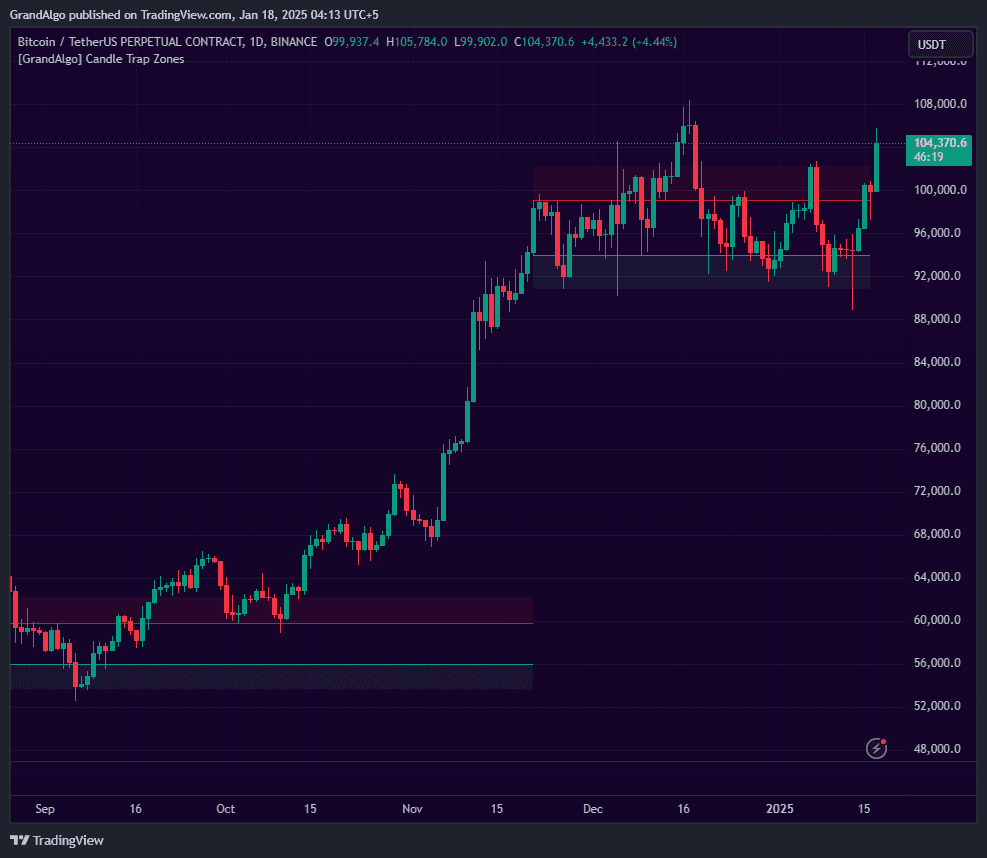
In Action
Candle Trap Zone applied across different markets.
Settings & Parameters
Key settings you can configure in TradingView.
| Parameter | Type | Default | Description |
|---|---|---|---|
| Strength | float | 0.6 | The minimum ratio of trapped candles required (0.5 to 1). Higher values produce fewer but stronger zones. |
| Draw Fib Cloud | float | 0.618 | Draws a Fibonacci cloud above and below the zone at the specified ratio, extending the zone's visual influence area. |
| Trap Detection Range | int | 30 | How many candles must be trapped within the zone to classify it as a trap zone. |
| Proximity Prevention | bool | true | Prevents new zones from forming when they overlap with existing zones, keeping the chart clean. |
| Auto Adjust Proximity | bool | false | When a new zone forms near an existing one, expands the existing zone to encompass both. |
| Extend on Re-entry | bool | true | Automatically extends the zone forward when price re-enters it after an initial reaction. |
How to Use It
Identify Fresh Trap Zones
Look for newly formed zones where price has just broken out. These represent areas where many traders are trapped and their stops create liquidity pools for potential reversals.
Watch the Cloud Extensions
The Fibonacci cloud projections above and below each zone mark the wider influence area. Price often reacts at cloud boundaries, not just at the core zone itself.
Trade Zone Retests
When price returns to a trap zone, watch for rejection signals. The trapped orders from the original consolidation create a natural reaction point that can be traded as a reversal or bounce setup.
Note Zone Breaks
When price slices cleanly through a zone, the trapped traders are liquidated and the zone loses its significance. Focus your attention on unbroken zones.
Best Practices
Start with Default Strength
The 0.6 default provides a good balance between sensitivity and quality. Only increase it if too many zones appear; decrease it if you want to catch more potential reversal areas.
Use Cloud Boundaries as Targets
The Fib cloud extensions provide natural take-profit levels when trading away from a zone, as price often stalls at these projected boundaries.
Combine with Volume
Zones that formed during high-volume periods are more significant because more traders are trapped at those levels, creating larger liquidity pools.
Pay Attention to Zone Age
Fresher zones are more actionable than older ones. As time passes, trapped traders gradually exit their positions, weakening the zone.
Related Indicators
Related Articles
Ready to Start Trading?
Get access to Candle Trap Zone alongside all 18 premium indicators.