Institutional Price Blocks
Detects order block candle patterns at market structure breaks and projects proprietary target zones where institutional orders are likely resting.
Institutional Price Blocks is an order block indicator that marks bullish and bearish blocks at confirmed BOS/CHOCH, then projects reaction zones. Treat the block as a high-probability retest area: wait for price to return, confirm with structure or rejection, and use the zone edge for risk. Once confirmed, blocks do not repaint.
Timeframes
All
Markets
All
Style
Overlay
Alerts
Built-in


Overview
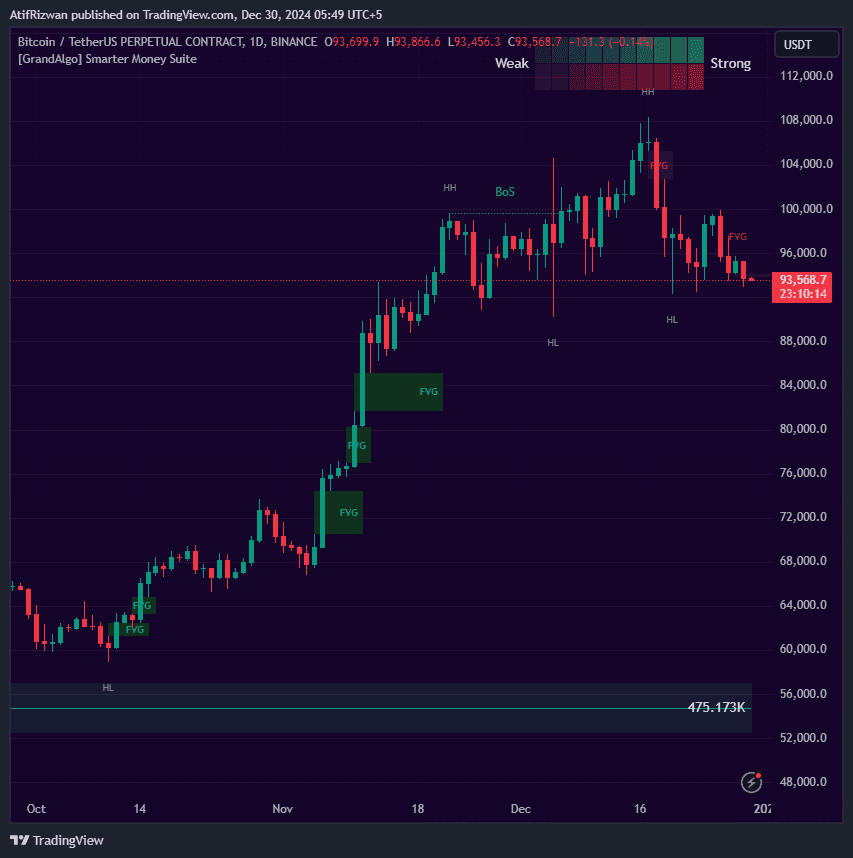
Institutional Price Blocks identifies distinct order block candle patterns that form at Break of Structure and Change of Character points. When a qualifying pattern is detected, the indicator projects target zones using proprietary extension logic, creating areas where institutional participants likely have unfilled orders. These zones are rendered as dynamic gradient-filled regions that appear when price enters the projection range and disappear when decisively invalidated. Two calculation modes let you choose between different projection approaches, and the indicator automatically filters out distant blocks to keep your chart focused on the nearest actionable levels.
How It Works
Institutional Price Blocks detects order block candle patterns that form at confirmed Break of Structure (BoS) and Change of Character (ChoCh) points. The algorithm uses configurable swing length to identify market structure pivots, then scans for specific candlestick formations at those pivots -- including single-candle engulfing patterns, two-bar reversals, and three-bar structural breaks. Each pattern must satisfy strict body-to-range ratios and directional criteria to qualify as a genuine institutional footprint.
Once a valid order block is identified, the indicator projects target zones using proprietary extension logic with two distinct calculation modes: Alpha and Beta. These projected zones represent price areas where unfilled institutional orders are statistically likely to rest. The zones are rendered as gradient-filled regions that appear when price enters the projection range.
Zones are automatically invalidated when price closes decisively beyond their boundaries, and the indicator filters out distant blocks to keep only the nearest actionable levels on your chart. An optional FVG overlap filter ensures that only order blocks coinciding with Fair Value Gaps are displayed, adding an extra layer of institutional confluence to every zone.
Key Features
Order Block Pattern Detection
Identifies multiple order block candle patterns at market structure break points where institutional positioning is most likely.
Proprietary Target Projection
Projects institutional target zones using proprietary extension logic -marking areas where unfilled institutional orders are likely resting.
Alpha & Beta Modes
Two calculation modes that change the projection approach, letting you choose the method that best fits your analysis.
Dynamic Gradient Visualization
Zones appear as gradient-filled regions only when price is in range, with automatic invalidation when price moves decisively beyond the zone.
Common Trading Setups
Practical ways to trade with Institutional Price Blocks.
Order Block Bounce Entry
Enter a trade when price pulls back into a bullish institutional price block that formed at a Break of Structure, targeting the projected extension zone above.
- 1Wait for a bullish BoS to confirm and an institutional price block to form at the swing low.
- 2Set an alert for price touching the demand-side block boundary.
- 3When price enters the block zone, look for a bullish reaction candle (hammer, engulfing, or pin bar) on your entry timeframe.
- 4Enter long with a stop-loss below the block's lower boundary.
- 5Target the projected institutional extension zone or the next supply level above.
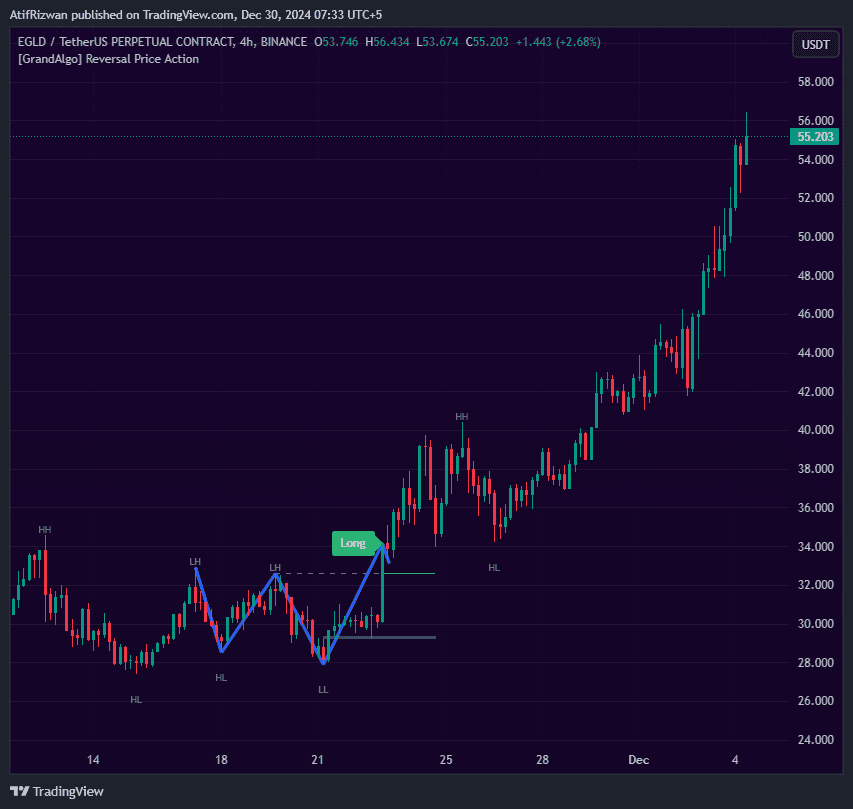
ChoCh Reversal with Price Block Confluence
Use a Change of Character event combined with an institutional price block to catch early trend reversals at high-probability levels.
- 1Identify a ChoCh event where the previous trend structure is broken for the first time.
- 2Confirm that an institutional price block has formed at the ChoCh swing point.
- 3Wait for price to retrace into the block zone after the initial displacement move.
- 4Enter in the direction of the new trend with a stop-loss beyond the block's invalidation level.
- 5Use the Alpha or Beta projected target as your primary take-profit zone.
Multi-Timeframe Block Stacking
Combine institutional price blocks from a higher timeframe with your trading timeframe to find zones where institutional interest converges across time horizons.
- 1Add the indicator to both your higher timeframe (e.g., 4H) and your trading timeframe (e.g., 15m).
- 2Identify a higher-timeframe institutional price block zone where a significant structure break occurred.
- 3Drop to your trading timeframe and wait for a new price block to form within the higher-timeframe zone.
- 4Enter when both timeframes agree on direction, using the lower-timeframe block for precise stop placement.
Settings Reference
Key settings you can configure in TradingView. See the full setup guide for detailed walkthroughs.
| Parameter | Type | Default | Description |
|---|---|---|---|
| Levels | string | Alpha | Two projection modes: Alpha uses one calculation approach for target zones, Beta uses an alternative method. Test both to find which suits your market. |
| Clouds | string | Both | Controls which gradient clouds are displayed: Both, Primary only, Secondary only, or None. |
| Swing Length | int | 10 | Number of candles required on each side to identify market structure. Lower values detect more structure breaks; higher values focus on major pivots. |
Pro Tips
Adjust Swing Length to Your Timeframe
Lower timeframes benefit from a shorter swing length (5-8) for more frequent detections. Higher timeframes work better with the default 10 or higher for major structure only.
Focus on the Nearest Block
The indicator automatically filters to show nearby blocks. The closest active block to the current price is the most relevant for your next trade.
Use Both Primary and Secondary Clouds
The primary and secondary projections often bracket a range. When both clouds are active, the area between them is a high-probability reaction zone.
Frequently Asked Questions
Alpha and Beta are two distinct projection approaches that change how target zones are calculated from the order block. Alpha uses a more conservative projection based on the block's own range, while Beta extends the projection further using the surrounding structure. Try both on historical data to see which aligns better with your market and timeframe.
The indicator applies strict filtering to keep only the most relevant blocks visible. Blocks are hidden if they are too far from the current price, if they have been invalidated by a decisive close beyond their boundaries, or if the FVG overlap filter is enabled and the block does not coincide with a Fair Value Gap.
No. Institutional Price Blocks does not repaint. Order blocks are confirmed only after the structure break is complete and the qualifying candle pattern has closed. Once a block is drawn, its position and boundaries do not change retroactively.
It detects institutional-style order block candle patterns that form at market structure breaks (BOS/ChoCh) and then projects the zones where price is most likely to react. It is built to keep the chart clean by showing only nearby, valid blocks rather than flagging every generic candlestick pattern.
Swing Length controls how many candles are required on each side of a pivot to confirm it as a valid market structure point. A lower value (e.g., 5) detects more frequent, smaller structure breaks and produces more blocks. A higher value (e.g., 20) focuses on major structural shifts and produces fewer, more significant blocks.
Get access to Institutional Price Blocks
Included with every subscription plan alongside all 18 premium indicators. Subscribe today for just $19/mo.
Related Articles
Related Indicators
More tools in Smart Money Concepts View all Smart Money Concepts →