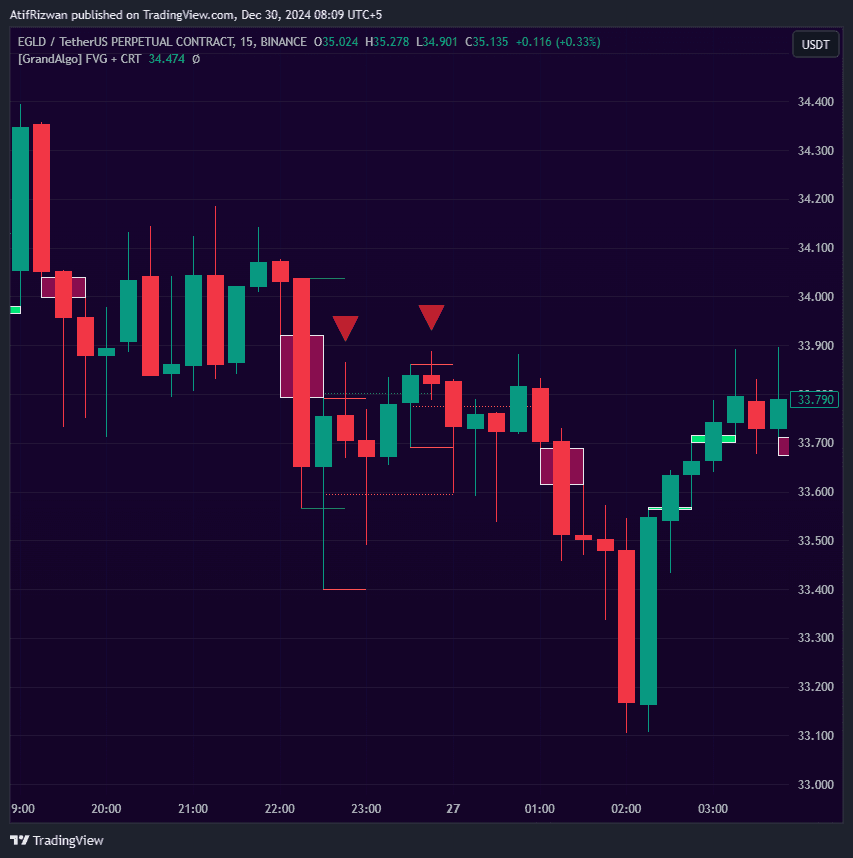
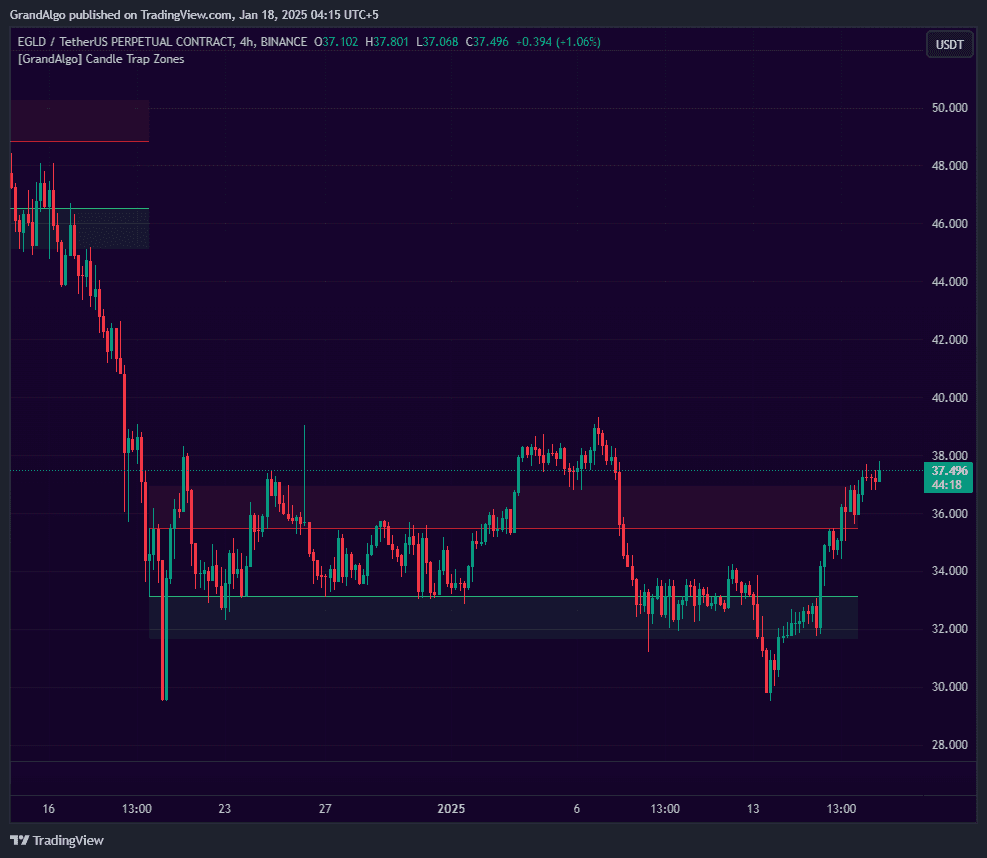
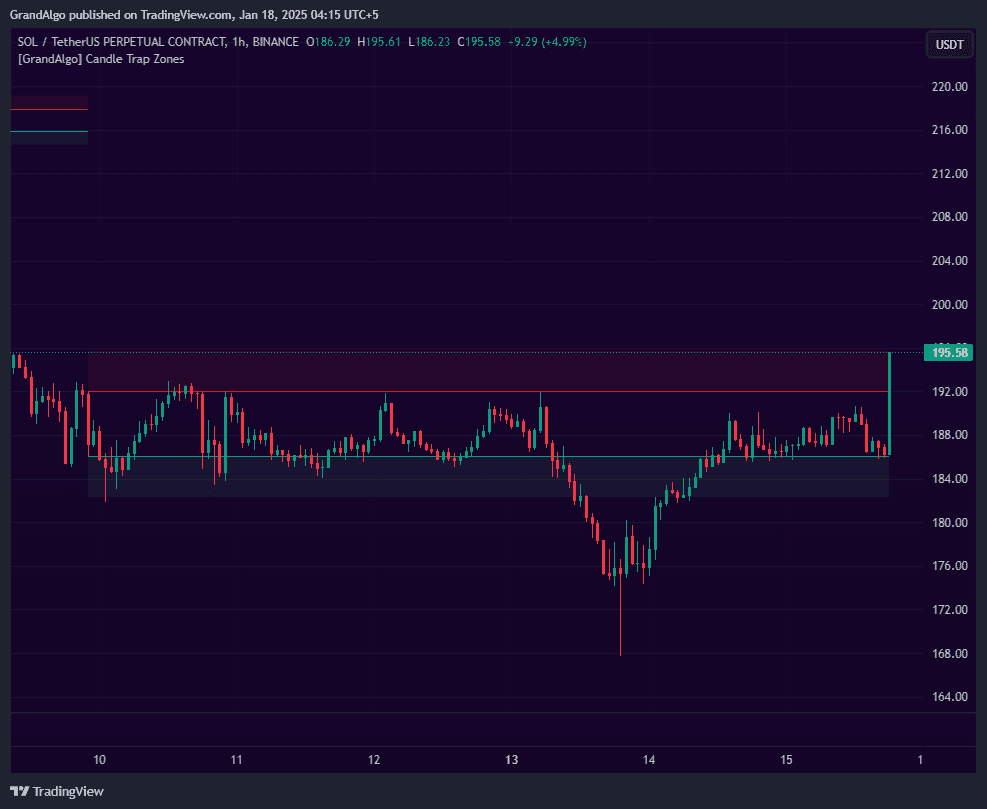
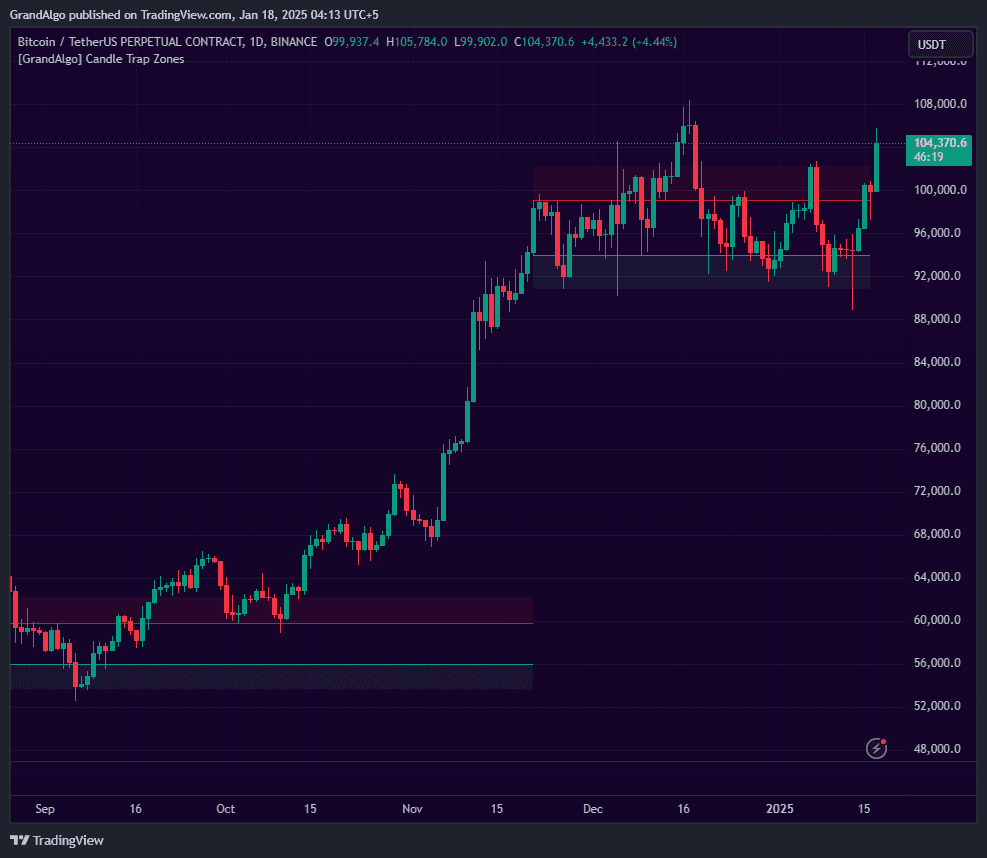
Candle Trap Zone
Identifies candles where the majority of surrounding price action is trapped within the range, marking high-probability reversal zones with cloud extensions.
Timeframes
All
Markets
All
Style
Overlay
Alerts
Built-in
Overview
Candle Trap Zone identifies specific candles where a significant percentage of surrounding candles are trapped within that candle's high-low range -a sign that the market consolidated heavily at that level. The indicator analyzes a configurable detection range, counting trapped candles and boundary touches to find zones with the strongest containment. When the trapped ratio exceeds your strength threshold, a zone is drawn with cloud extensions projecting above and below, creating a wider influence area. Zones auto-extend when price re-enters, and smart proximity detection prevents overlapping zones or optionally merges nearby zones into one expanded area.
How It Works
Candle Trap Zone scans a configurable detection range (default 30 candles) and evaluates each candle to determine how many of the surrounding candles are "trapped" within its high-low range. For each reference candle, the algorithm counts how many candles have their close price contained within the reference candle's range, as well as how many candles touch the upper or lower boundaries. If the trapped ratio exceeds your Strength threshold (0.5 to 1.0) and boundary touches meet a minimum frequency, the candle qualifies as a trap zone.
When a trap zone is confirmed, the indicator draws the zone's upper and lower boundaries as horizontal lines and projects Fibonacci-based cloud extensions above and below. The cloud extension distance is calculated by multiplying the zone's range by a configurable Fibonacci level (default 0.618), creating an expanded area of influence. These clouds represent the zone's extended reach -- price often reacts not just at the zone itself but within the cloud region.
Smart proximity detection prevents overlapping zones from cluttering the chart. When a new zone forms within 3 ATR of an existing zone, it can either be blocked (preventing the new zone) or merged (expanding the existing zone to encompass both). Zones automatically extend when price re-enters them, and optional touch detection marks the exact candles where price interacts with zone boundaries or cloud edges.
Key Features
Trapped Candle Analysis
Analyzes how many candles are trapped within a reference candle's range -zones form only when the trapped ratio exceeds your configurable strength threshold.
Cloud Extensions
Projects semi-transparent cloud areas above and below each zone, extending the zone's visual influence area for wider context.
Proximity & Auto-Adjust
Prevents overlapping zones when new ones form near existing zones, or optionally expands the existing zone to encompass both.
Touch Detection & Alerts
Detects price touching zone boundaries and extension lines with optional visual markers and multiple alert types.
Common Trading Setups
Practical ways to trade with Candle Trap Zone.
Cloud Bounce Reversal
Enter a reversal trade when price enters a Fibonacci cloud extension and shows rejection, targeting the opposite side of the trap zone.
- 1Identify an active trap zone with visible cloud extensions above and below.
- 2Wait for price to approach and enter one of the cloud regions (green cloud below for longs, red cloud above for shorts).
- 3Look for a rejection candle within the cloud -- a long wick, pin bar, or engulfing pattern that shows the cloud is acting as support/resistance.
- 4Enter in the reversal direction with a stop-loss beyond the cloud's outer edge.
- 5Target the opposite cloud region or the trap zone's core boundary on the other side.
Zone Breakout and Retest
Trade breakouts when price escapes a trap zone after extended consolidation, using the broken zone boundary as a retest entry level.
- 1Identify a trap zone where price has been contained for multiple candles, showing clear consolidation.
- 2Wait for a decisive candle close beyond either the upper or lower zone boundary.
- 3After the breakout, wait for price to pull back and retest the broken boundary (the zone line now acts as support or resistance).
- 4Enter in the breakout direction on the retest candle's confirmation.
- 5Place your stop-loss inside the zone and target a measured move equal to the zone's range.
Range Trading Within the Zone
Trade back and forth between zone boundaries when price is trapped and the market is ranging, using the zone's high and low as natural entries and exits.
- 1Confirm that the trap zone is active and price is clearly ranging between the upper and lower boundaries.
- 2Go long at the lower boundary when price touches it and shows a bullish reaction.
- 3Go short at the upper boundary when price touches it and shows a bearish reaction.
- 4Use tight stop-losses just beyond the boundary lines.
- 5Exit at the opposite boundary or at the zone midpoint if momentum fades.
Settings Reference
Key settings you can configure in TradingView. See the full setup guide for detailed walkthroughs.
| Parameter | Type | Default | Description |
|---|---|---|---|
| Strength | float | 0.6 | The minimum ratio of trapped candles required (0.5 to 1). Higher values produce fewer but stronger zones. |
| Draw Fib Cloud | float | 0.618 | Draws a Fibonacci cloud above and below the zone at the specified ratio, extending the zone's visual influence area. |
| Trap Detection Range | int | 30 | How many candles must be trapped within the zone to classify it as a trap zone. |
| Proximity Prevention | bool | true | Prevents new zones from forming when they overlap with existing zones, keeping the chart clean. |
| Auto Adjust Proximity | bool | false | When a new zone forms near an existing one, expands the existing zone to encompass both. |
| Extend on Re-entry | bool | true | Automatically extends the zone forward when price re-enters it after an initial reaction. |
Pro Tips
Start with Default Strength
The 0.6 default provides a good balance between sensitivity and quality. Only increase it if too many zones appear; decrease it if you want to catch more potential reversal areas.
Use Cloud Boundaries as Targets
The Fib cloud extensions provide natural take-profit levels when trading away from a zone, as price often stalls at these projected boundaries.
Combine with Volume
Zones that formed during high-volume periods are more significant because more traders are trapped at those levels, creating larger liquidity pools.
Pay Attention to Zone Age
Fresher zones are more actionable than older ones. As time passes, trapped traders gradually exit their positions, weakening the zone.
Frequently Asked Questions
The Strength threshold (0.5 to 1.0) determines what percentage of candles within the detection range must be trapped inside the reference candle's range for a zone to qualify. A value of 0.6 means at least 60% of candles must be contained. Higher values produce fewer but stronger zones; lower values produce more zones with potentially weaker containment.
The cloud extension projects a semi-transparent region above and below each trap zone. The distance is calculated by multiplying the zone's range (high minus low) by a Fibonacci level you choose (default 0.618). The cloud represents the zone's extended area of influence. Price often reacts within the cloud before reaching the core zone, making it useful as an early warning or entry region.
If you prefer clean charts with non-overlapping zones, enable the proximity blocking option (Don't create new zone when found in proximity). If you want zones to grow when new trap areas form nearby, enable Auto Adjust instead. For most trading styles, proximity blocking is the better default because it prevents chart clutter while keeping the strongest zone intact.
Candle Trap Zone works on all markets (crypto, forex, stocks, futures) and all timeframes. It is particularly effective on ranging or consolidating markets where price tends to get trapped at key levels. On very low timeframes (1-minute), consider increasing the detection range to capture meaningful zones. On higher timeframes (Daily, Weekly), the default settings usually work well.
Get access to Candle Trap Zone
Included with every subscription plan alongside all 18 premium indicators. Subscribe today for just $19/mo.
Related Articles
Related Indicators
More tools in Price Action Toolkit View all Price Action Toolkit →