ICT Midnight Open & True Day Open: The Daily Reference Price, Tested
What the ICT Midnight Open and True Day Open are, why the two disagree, and what three years of data says about the midnight open retracement. A reference line, not an edge.

Almost every ICT resource names the Midnight Open as the single most important daily bias reference. The claim is easy to state and almost never tested: price above the midnight open means bullish intent, price below means bearish intent.
It is a clean idea, and the site has referenced daily bias sixteen times without ever naming the level that most ICT traders hang it on. This post fixes that. It defines both daily reference prices properly, explains why they disagree, and then does the thing the other guides skip: it checks whether the level actually does anything.
What Is the ICT Midnight Open?
The Midnight Open is the opening price of the 00:00 candle in New York local time. Not UTC, not your broker's server time. New York, so it follows US daylight saving automatically.
The reasoning behind it is straightforward. If the trading day is a single delivery cycle, then it needs a starting price, and everything that happens after is either above that price (premium) or below it (discount). That makes the MO a dividing line rather than a support or resistance level:
- Price trading above the MO puts the day in premium. The ICT read is to look for sells back down toward discount.
- Price trading below the MO puts the day in discount. The read is to look for buys back up toward premium.
This is the same premium/discount logic used in PD arrays and the dealing range, applied to a single day using a single price instead of a range.
The MO also gets used as an intraday reference that price "reacts" to when it trades back into it. That second claim is the one worth testing, and we test it below.
What Is the True Day Open?
The True Day Open is the 18:00 ET open. In ICT's framing, the retail calendar day starting at midnight is an accounting convention, not a market one. The futures session actually rolls at 18:00 ET the evening before, including the Sunday 6 PM restart after the weekend.
So the True Day Open is ICT's answer to "when does the trading day actually begin?" It is used the same way as the MO, as a bias divider, but anchored to the session rollover rather than to the clock.
Why Do the Midnight Open and True Day Open Disagree?
Because six hours of trading sit between them.
The 18:00 ET open comes before the Asian session. The 00:00 ET open comes after Asia has already had several hours to move price. On a quiet night the two prices sit almost on top of each other and the distinction does not matter. On a night where Asia trends or a data release lands, they can be far apart, and they will put the day in opposite states: above one, below the other.
When they disagree, there is no ICT rule that resolves it. In practice traders pick one and stay consistent. If you trade index futures, the TDO matches the instrument's actual session boundary. If you trade the New York session specifically, the MO is closer to the move you care about. Neither choice is better in our data. They tested within about three points of each other on every symbol.
Does the Midnight Open Actually Predict the Day?
This is where the usual guide stops and asserts. We measured it instead.
The test. Binance perpetual futures, 15-minute candles, June 2023 to June 2026, on BTC, ETH, SOL and BNB. For each New York day we took the MO as the open of the 00:00 ET candle, then asked whether the 16:00 ET close finished on the same side of the MO as the 09:30 ET open. We only counted days where 09:30 sat a meaningful distance from the MO, so a "hold" means something. That left roughly 760 qualifying days per symbol.
The headline number looks excellent. The bias held on 77.6% (BTC), 82.2% (ETH), 79.6% (SOL) and 83.2% (BNB) of qualifying days. Four out of five days finish on the side they started. If we stopped here, this post would be recommending the midnight open as a high-probability bias filter.
So we ran a control. We repeated the identical measurement on a level with no ICT meaning at all: the mirror of the MO reflected about the 09:30 price. Same distance from price, same geometry, zero significance.
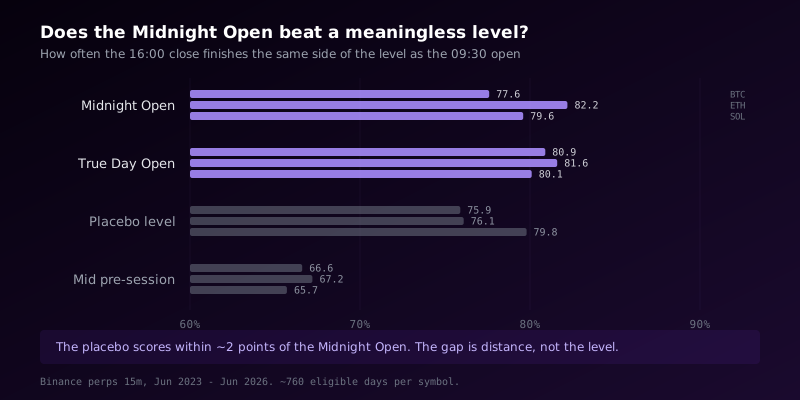
The placebo scored 75.9% (BTC), 76.1% (ETH) and 79.8% (SOL). On SOL it beat the Midnight Open outright.
That result is decisive. The 80% figure is not measuring anything about midnight. It is measuring distance. A level that far from price simply does not get crossed back through and closed beyond very often, whatever you call it. The fourth level we tested makes the mechanism obvious: the midpoint of the overnight range, which sits close to price rather than far from it, held only 66% of the time and got touched on 66% to 71% of days.
Far levels hold. Near levels get run. Midnight has nothing to do with it.
What About the Midnight Open Retracement?
The other common claim is that price tends to trade back to the MO during the New York session. Same data, same qualifying days, asking only whether price traded through the MO at any point between 09:30 and 16:00 ET.
It happened on 46.2% (BTC), 42.4% (ETH), 39.2% (SOL) and 35.9% (BNB) of qualifying days. When it did happen, the median tag came between 10:15 and 10:45 ET, which at least matches the folklore about the first hour or two.
But under half is not a tendency you can lean on, and the control does not rescue it either: the placebo level got touched more often than the MO on all three symbols we controlled (47.1%, 50.3% and 43.0%). We also measured what happened after the touch, scoring whether price rejected the level or sliced through it. The Midnight Open rejected 63.1%, 68.0% and 55.8% of the time against the placebo's 63.6%, 59.2% and 58.2%. Better on one symbol, worse on another, tied on the third. That is noise, not an edge.
GrandAlgo
See these concepts automated on your charts
18 TradingView indicators — smart money, price action, supply/demand, and more.
So What Is the Midnight Open Actually For?
It is a reference line, and that is a genuinely useful thing to be. It is not a signal.
A single price level with nothing else at it is a line on a chart. What our testing rules out is treating the MO as a standalone reason to act. What it does not rule out is using it the way every other level on your chart earns its place: as one vote among several.
The MO becomes worth acting on when it converges with something independent:
- A PD array or unfilled fair value gap sitting at the same price
- The previous day's high or low
- A session extreme, or the Asian range boundary
- The weekly open, or an opening gap edge
- A clear draw on liquidity in the same direction
We tried to measure the confluence case directly, pairing the MO with the previous day's high or low. Honest answer: after filtering, only seven to twelve days per symbol qualified. That sample proves nothing, and we are not going to dress it up as a finding. The confluence recommendation here rests on the same logic that runs through every post on this site about single signals, not on a number we measured.
Here is the practical version. On the chart at the top of this post, real BTC on 18 December 2023, price opened the session above the Midnight Open at 41,206, sold back into it through the morning, tagged it at 11:00 ET with a low of 41,170, and closed the session at 41,994. Textbook. It is also the single cleanest example our scan found in 1,094 trading days, which tells you exactly how often the textbook version shows up.
How Do You Mark the Midnight Open?
- Set your chart to New York time. This is the step people get wrong. If your platform is on UTC or broker time, your midnight is not ICT's midnight, and during daylight saving transitions it will drift by an hour.
- Take the 00:00 candle's open, not its close and not the previous candle's close.
- Extend it across the day to 16:00 ET, or to the 18:00 rollover if you are also tracking the True Day Open.
- Mark the 18:00 ET open too if you trade futures, and note when the two disagree. Disagreement is information: it means Asia moved price meaningfully.
- Leave them as context lines. Thin, muted, not the loudest thing on your chart. They are there to tell you which half of the day you are in, not to generate entries.
What Are the Limits of This Test?
Worth stating plainly, because it cuts against our own conclusion.
This was run on crypto perpetual futures, which trade 24/7. The Midnight Open is a concept borrowed from index futures and forex, where sessions genuinely open and close and where the 18:00 ET rollover is a real structural boundary rather than an arbitrary timestamp. It is entirely possible the level behaves differently on ES or NQ, and our data cannot speak to that.
What the test does establish is that the level's most-repeated statistic, the 80% bias-hold figure, is reproducible on crypto and is fully explained by distance rather than by midnight. Anyone quoting a number like that for any market should be asked what their control was. If the answer is that there wasn't one, the number does not mean what it appears to mean.
How Does This Fit With Indicators?
The tedious part of this is the marking: getting the timezone right, redrawing two levels every session, and then keeping track of which other references they line up with. That is exactly the kind of bookkeeping worth automating, which is what tools like the MTF Confluence Key Levels indicator are for. It plots session opens and higher-timeframe levels together so the convergence is visible without you rebuilding the chart daily.
The tool draws the lines. Deciding whether a line matters is still your job, and this post is about how to make that decision honestly.
Frequently Asked Questions
The Midnight Open is the opening price of the 00:00 candle in New York local time. ICT traders use it as the day's premium/discount divider: price above it puts the day in premium, price below it puts the day in discount.
The True Day Open is the 18:00 ET futures session open, including the Sunday 6 PM restart. ICT treats this as the real start of the trading day rather than the midnight calendar boundary.
Six hours of trading. The True Day Open at 18:00 ET comes before the Asian session, the Midnight Open at 00:00 ET comes after it. On quiet nights they are nearly identical. When Asia moves price they can put the day in opposite states, and there is no ICT rule for resolving the conflict.
No. In our testing on three years of BTC, ETH, SOL and BNB 15-minute data, price traded back to the Midnight Open during the New York session on 36% to 46% of qualifying days. A control level with no meaning was touched slightly more often.
Less than it appears. The bias held on 78% to 83% of days in our test, but a meaningless control level placed the same distance from price scored 76% to 80%. The apparent edge is explained by how far the level sits from price, not by the level itself. Use it as a context line alongside independent confluence, not as a standalone signal.
New York local time (America/New_York), which handles US daylight saving automatically. Using UTC or broker server time will put your level in the wrong place and shift it by an hour twice a year.
What Are the Key Takeaways?
- The Midnight Open is the 00:00 New York open, used as the day's premium/discount divider
- The True Day Open is the 18:00 ET futures open, ICT's real start of the trading day
- The two disagree whenever Asia moves price, and no ICT rule resolves the conflict. Pick one and stay consistent
- The widely quoted ~80% bias-hold rate reproduces on crypto, but a meaningless control level scores within about two points of it. The effect is distance, not midnight
- The midnight open retracement happened on under half of qualifying days, and a control level was touched more often
- Mark both levels as muted context lines. They tell you which half of the day you are in
- Act on the Midnight Open only where it converges with an independent reference: a PD array, a session extreme, the previous day's high or low, or a clear draw on liquidity
- Set your chart to New York time before doing any of this


