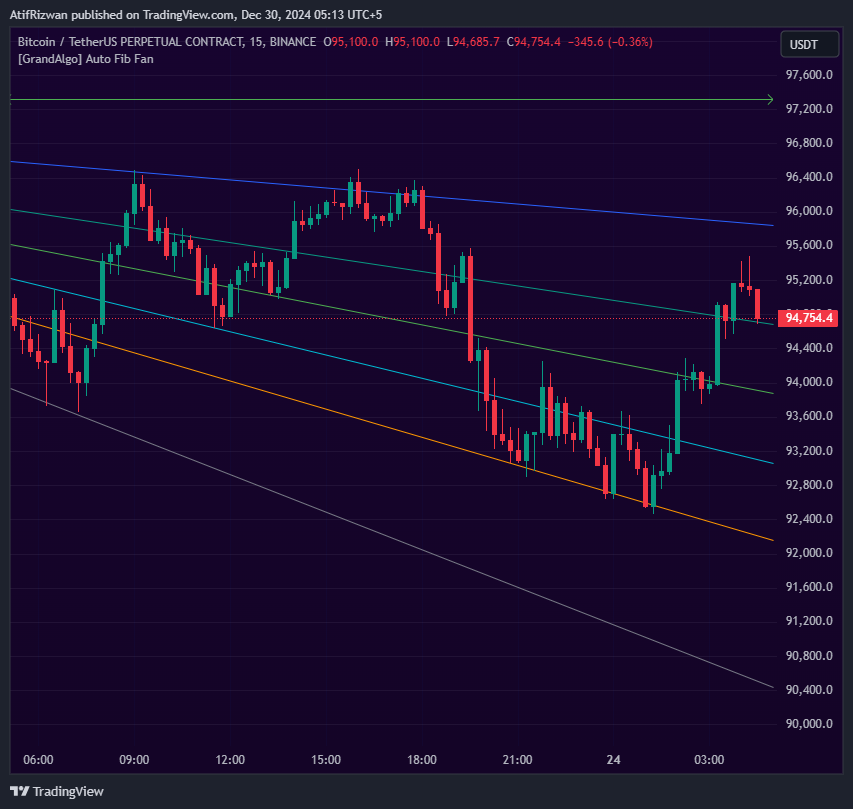
The Sessions Fib Fan script simplifies technical analysis by automatically plotting Fibonacci Fans on daily levels or any chosen timeframe. This dynamic tool resets and recalculates the Fib Fan levels at the start of each new day (or the selected timeframe), ensuring that the analysis stays up-to-date with the latest market structure.

The MTF Confluence Key Levels indicator is designed for traders seeking an edge in identifying high-probability zones using a subtle yet sophisticated approach. Whether you trade reversals, breakouts, or trend continuations, this tool equips you with the insights needed to stay ahead in the markets.
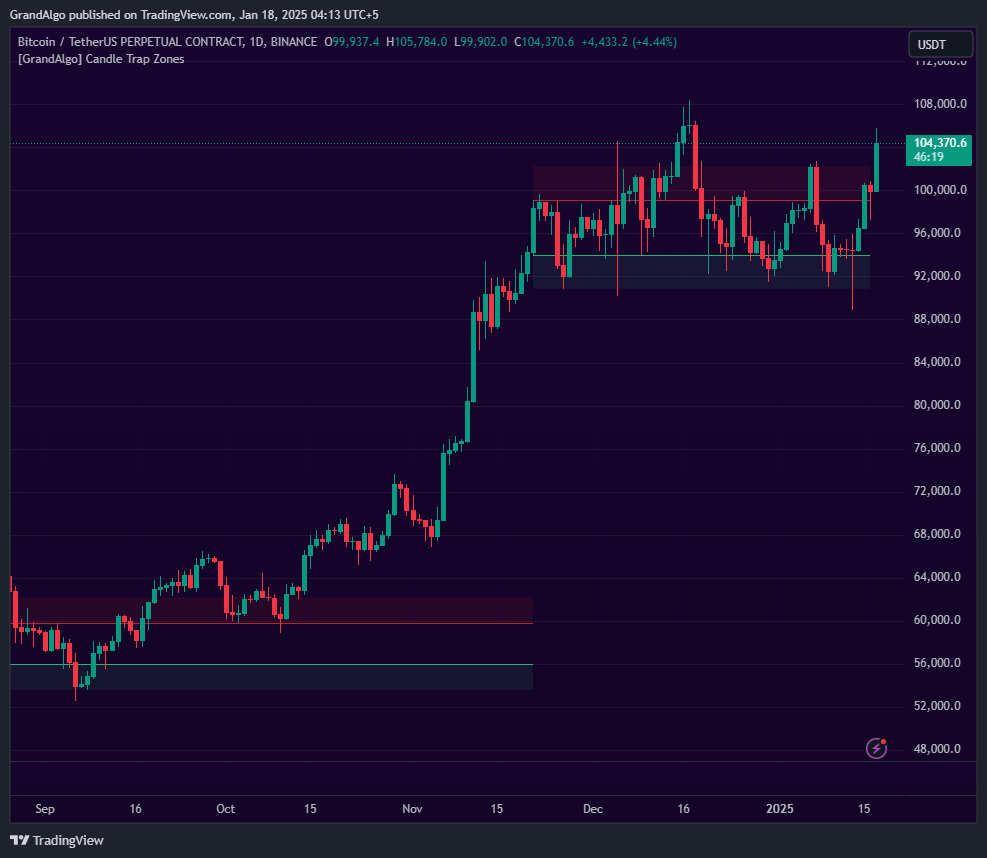
The Candle Trap Zones indicator is an essential tool for traders seeking a deeper understanding of price action and market dynamics. Whether you are trading breakouts, reversals, or trends, this indicator provides the clarity and precision needed to identify high-probability zones and make informed trading decisions with confidence.
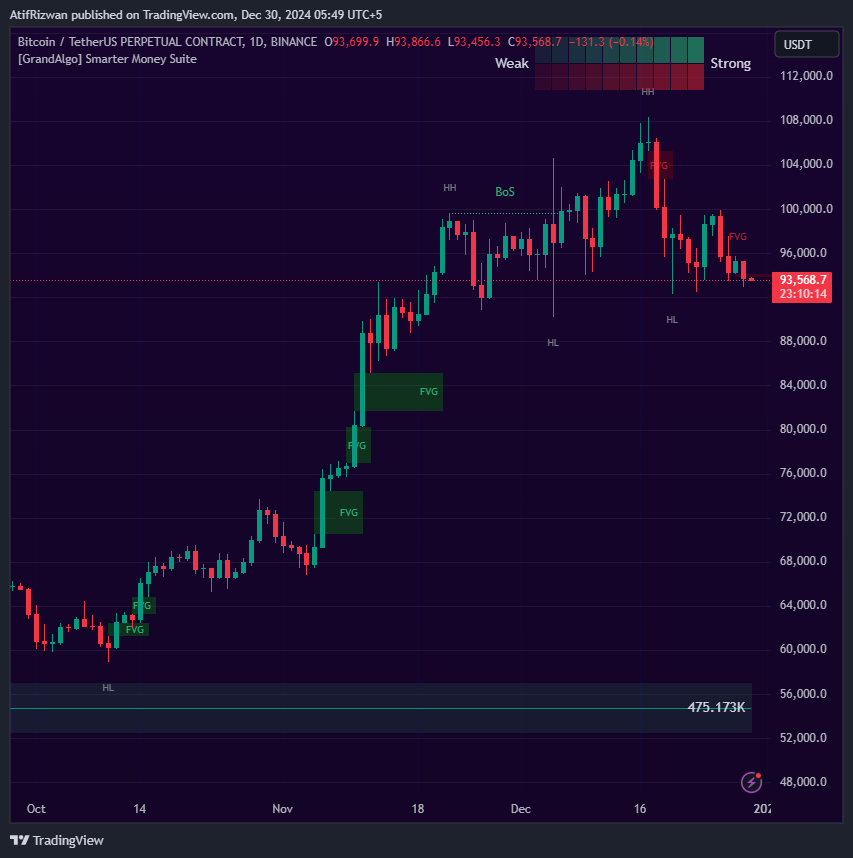
The Smarter Money Suite is built for traders who demand more than the ordinary. Whether you’re a trend follower, scalper, or swing trader, this suite equips you with smarter tools to navigate the markets confidently and effectively. Redefine your edge with the Smarter Money Suite.
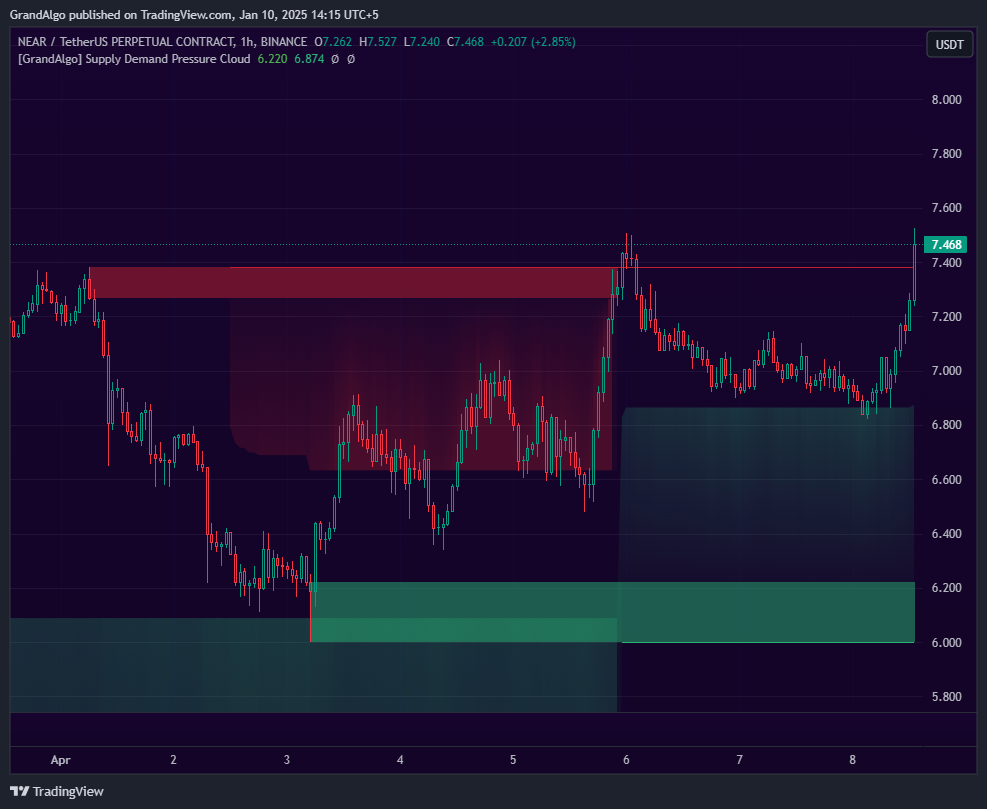
Whether you’re a scalper, day trader, or swing trader, the Supply Demand indicator empowers you with the clarity and precision needed to trade confidently. Focus on what matters and let the Supply Demand indicator handle the complexities for you.
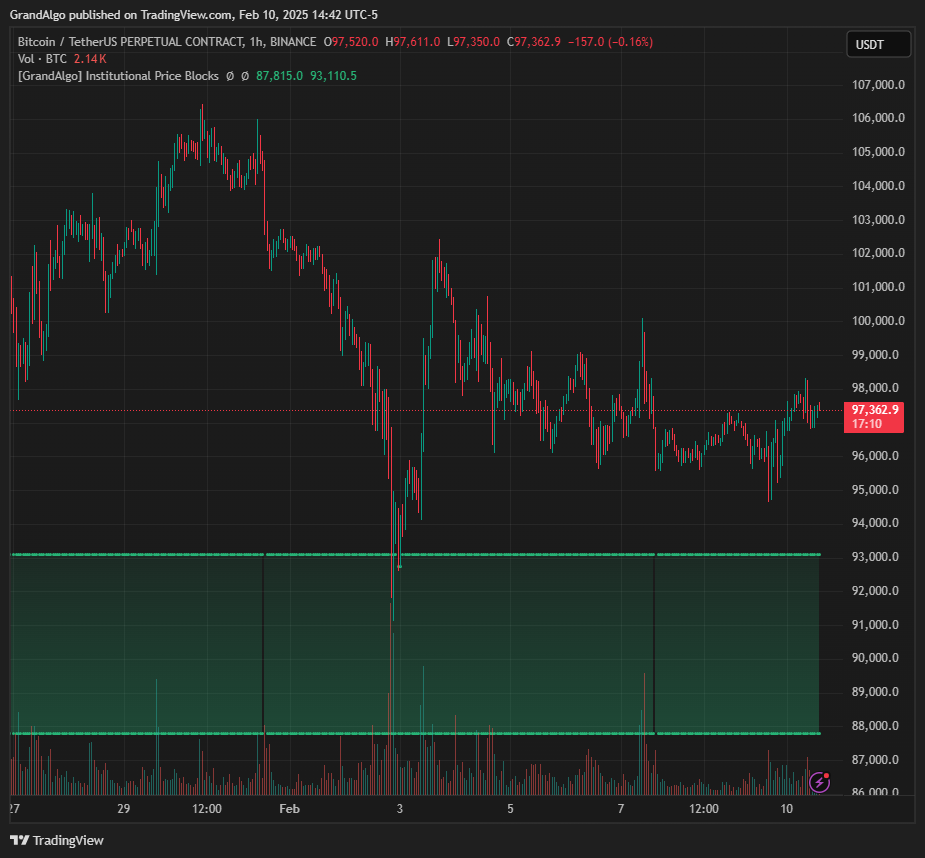
Institutional Price Blocks offer traders a powerful way to understand the hidden forces that move the market. By identifying these zones and aligning your trades with institutional activity, you can improve your trading accuracy and avoid common pitfalls that trap retail traders.
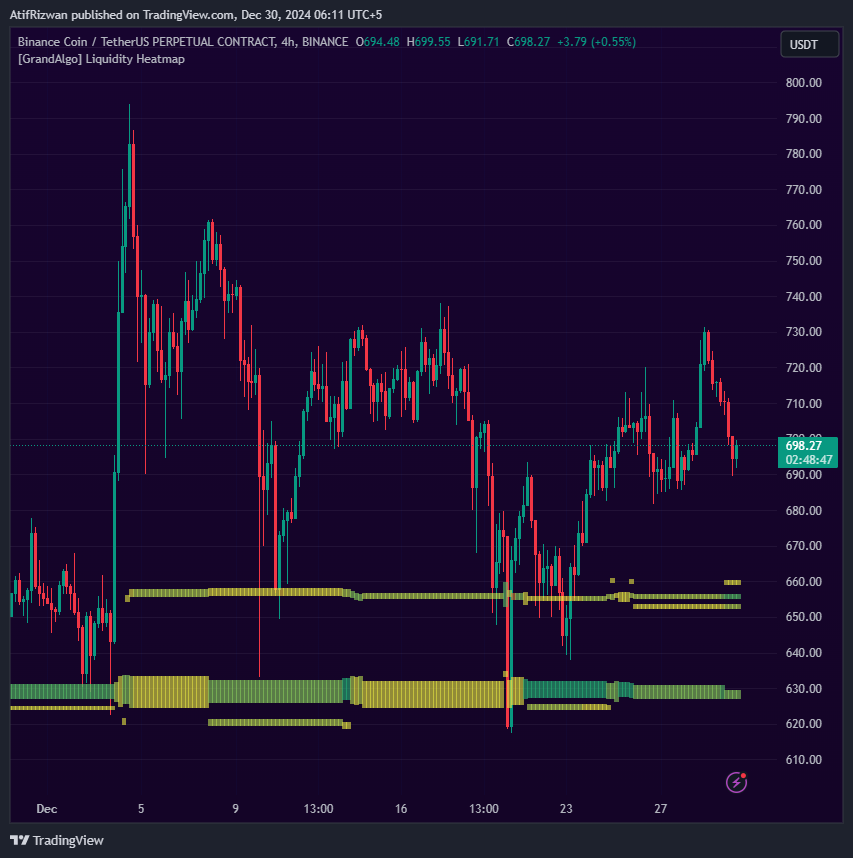
Whether you’re trading breakouts, reversals, or consolidations, the Liquidity Heatmap equips you with a clear and powerful tool to visualize market liquidity and gain an edge in your trading strategy.
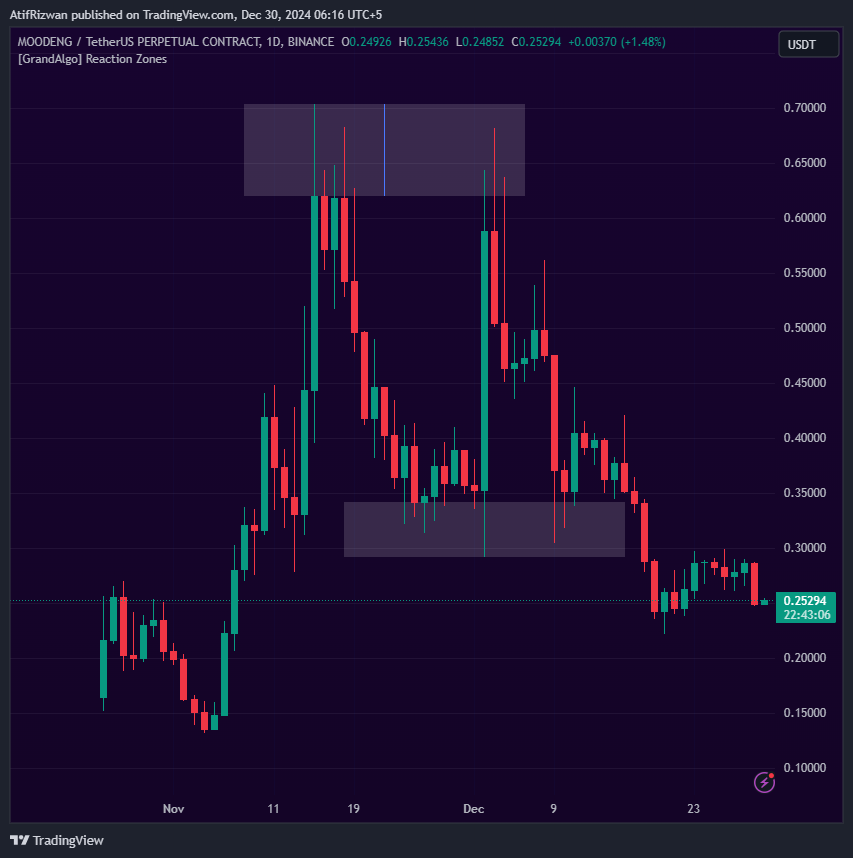
The Reaction Zones indicator is ideal for traders who want a clear, focused view of liquidity zones to better anticipate market reactions and improve trading outcomes. Stay ahead of the market with the precision and clarity provided by Reaction Zones.
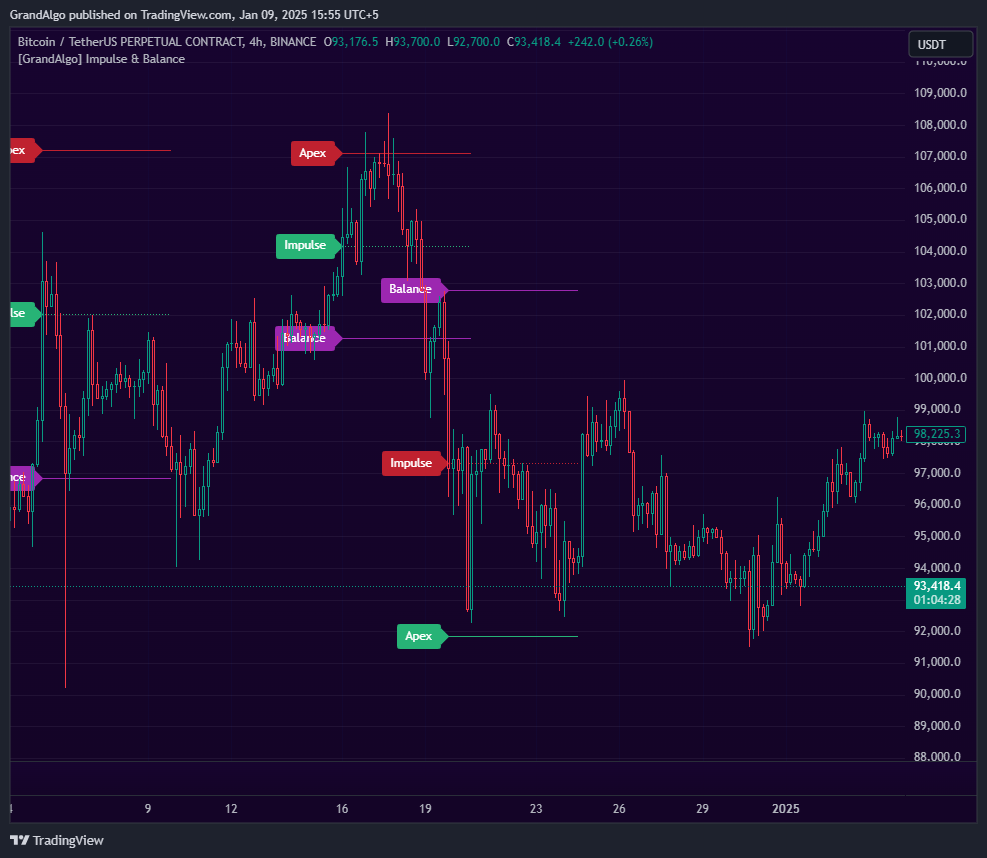
Impulse & Balance is a versatile TradingView indicator designed to identify and label critical market dynamics based on key price action behavior. It highlights three essential levels: Impulse, Balance, and Apex, offering traders a structured view of market trends, momentum shifts, and potential reversal points
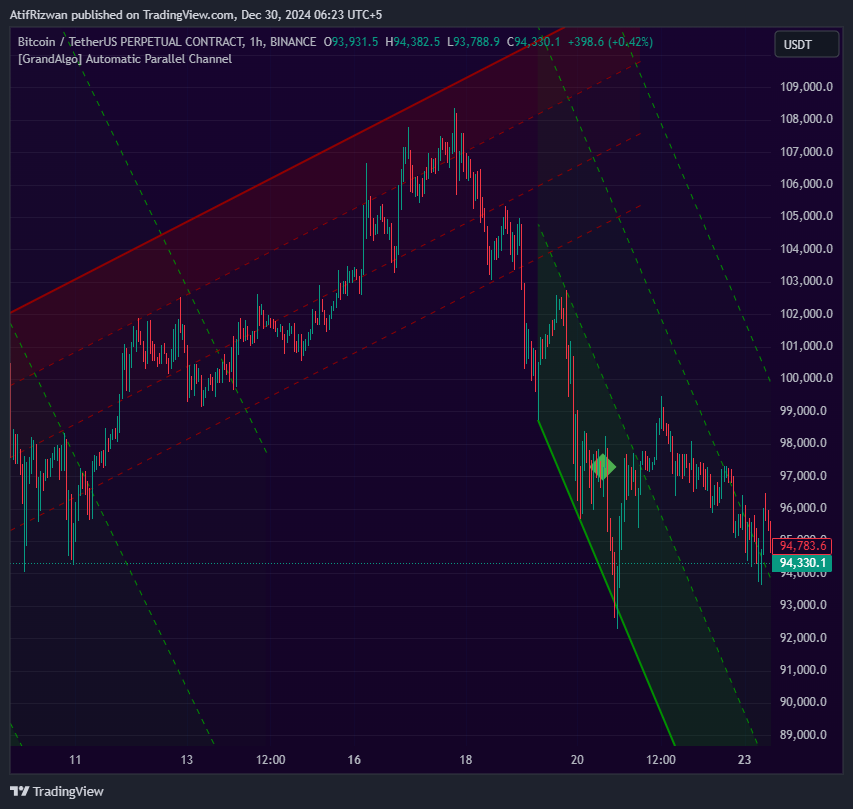
The Automatic Parallel Channel indicator is perfect for traders who want an efficient way to incorporate channel analysis into their strategy. Focus on trading opportunities, while this tool takes care of channel identification and dynamic updates.
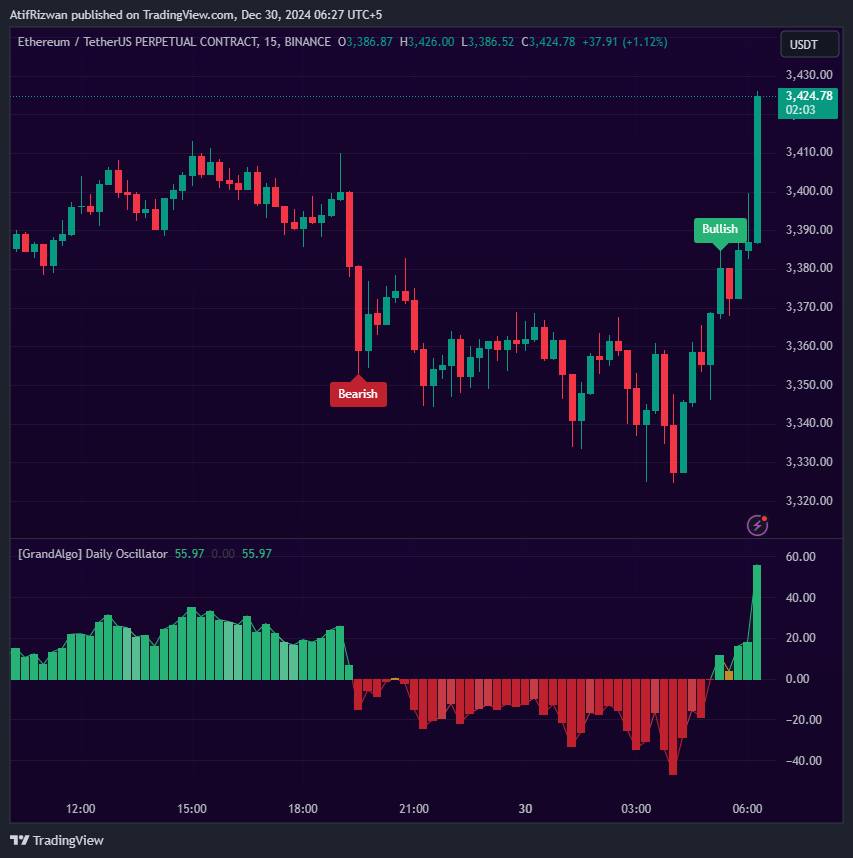
The Daily Oscillator is a must-have tool for intraday traders, providing precise daily trend insights to support better-informed trading decisions. Simplify your intraday analysis and trade with confidence using the Daily Oscillator.
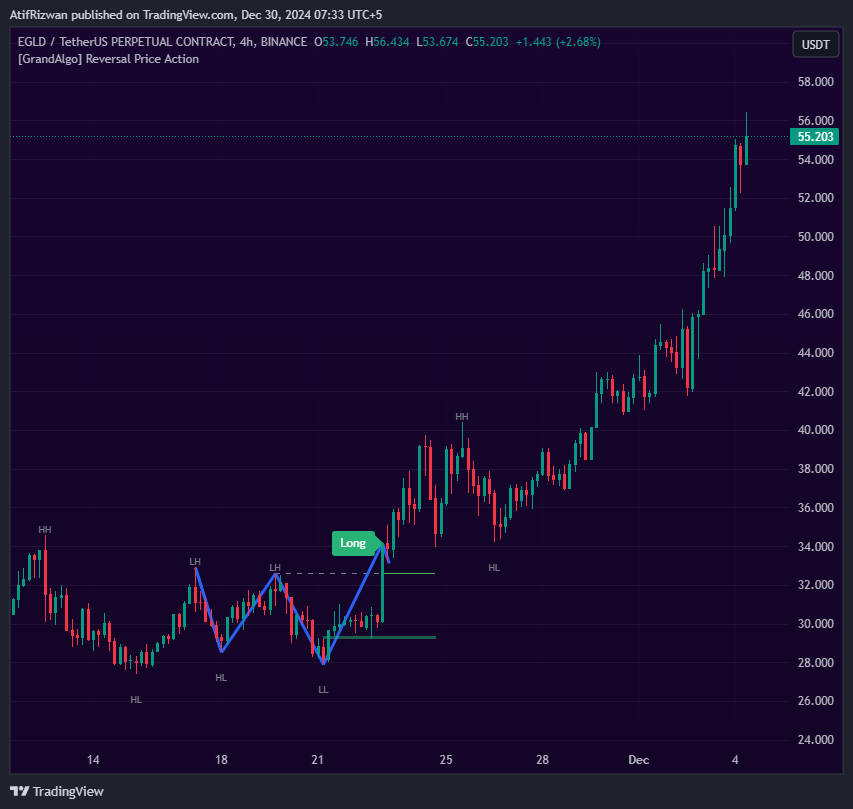
The Reversal Market Structure indicator is ideal for traders looking to capitalize on trend reversals, identify retracement opportunities, and gain an edge in both trending and ranging markets. Combine structure clarity with precise FVG insights to make smarter trading decisions with the Reversal Price Structure tool.
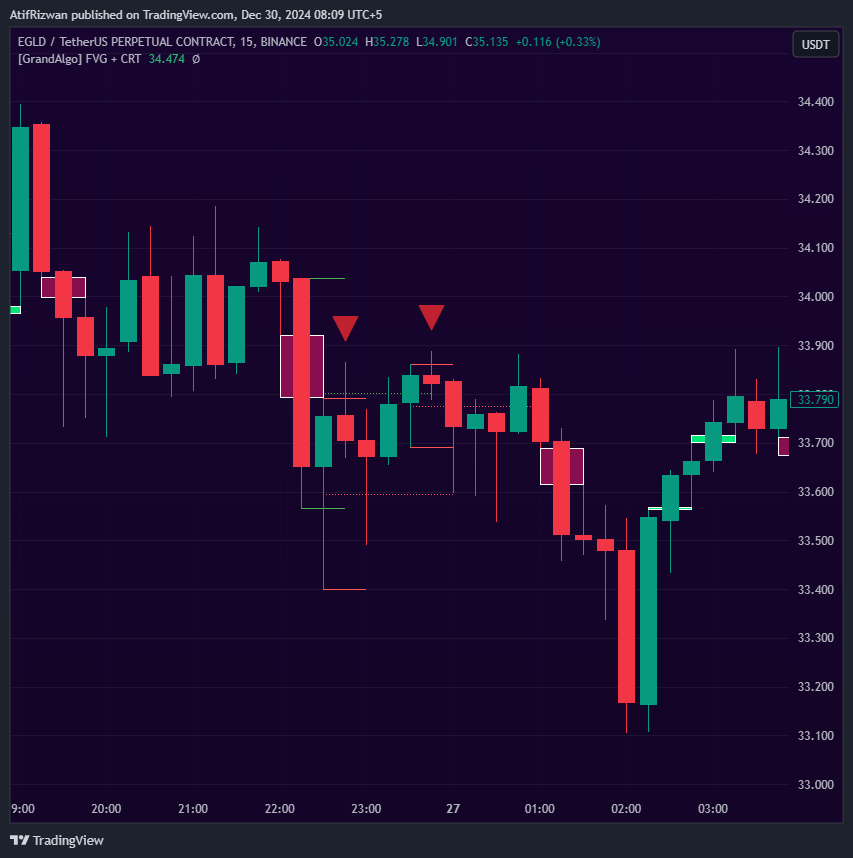
The CRT with Key Levels indicator is an essential tool for traders looking to integrate range sweeps with advanced key level detection to spot high-probability reversals and make informed trading decisions. Enhance your trading strategy with this reliable and adaptable indicator.
Useful Links
Disclaimer: The tools and indicators provided by GrandAlgo.com are for educational purposes only and do not constitute financial advice. Trading involves significant risk, and past performance is not indicative of future results. Use at your own discretion.