


In trading, the battle between supply and demand determines market direction. When demand exceeds supply, prices rise. When supply overtakes demand, prices fall. However, identifying these imbalances in real time is not always straightforward. This is where the Supply Demand Pressure Cloud indicator comes in.
The Pressure Cloud provides traders with a dynamic view of market pressure, helping them visualize key zones where price is most likely to react. Whether you are trading Forex, crypto, stocks, or indices, understanding supply and demand pressure can enhance your ability to spot trend continuations, reversals, and breakouts with greater accuracy.
Supply and demand are the foundation of all price movements in financial markets. When traders buy more than what is available at a certain price level, the market moves up. When sellers outnumber buyers, price declines. The key is recognizing where these imbalances exist so you can anticipate potential movements before they happen.
However, supply and demand are not static. They constantly shift due to changes in market sentiment, economic events, and institutional activity. Identifying these shifts early can give traders a major advantage. The Supply Demand Pressure Cloud helps map these zones by showing how strong or weak supply and demand levels are in real time.
Unlike traditional support and resistance tools, the Pressure Cloud does not rely on static price levels. Instead, it dynamically updates based on real-time market conditions, showing areas where price is likely to react.
The Pressure Cloud categorizes market pressure into three levels, helping traders gauge potential price reactions:
By visually mapping these pressure levels, traders can quickly identify where the market is likely to reverse, continue trending, or consolidate.
The indicator does not just highlight supply and demand zones—it adjusts dynamically based on price action. As price moves closer to Strong Pressure Zones, reactions become more likely. If price hovers within a Moderate or Mild Pressure Zone, the probability of a reaction is lower but still present.
This proximity-based approach helps traders assess the significance of supply and demand in real-time, rather than relying on outdated levels.
Every trader has a different approach. The Supply Demand Pressure Cloud allows full customization of pressure cloud sensitivity, display settings, and timeframe compatibility, ensuring it aligns with your trading strategy.
You can adjust:
This flexibility ensures that whether you are a scalper, day trader, or swing trader, you can fine-tune the indicator to match your market approach.
The Supply Demand Pressure Cloud is designed to work across all markets, including:
This versatility means you can use the Pressure Cloud for different asset classes without adjusting your strategy significantly. It adapts to market conditions automatically, making it a powerful addition to any trader’s toolkit.
Instead of cluttering your chart with multiple lines or conflicting indicators, the Pressure Cloud provides a simple and effective visualization of key price reaction zones.
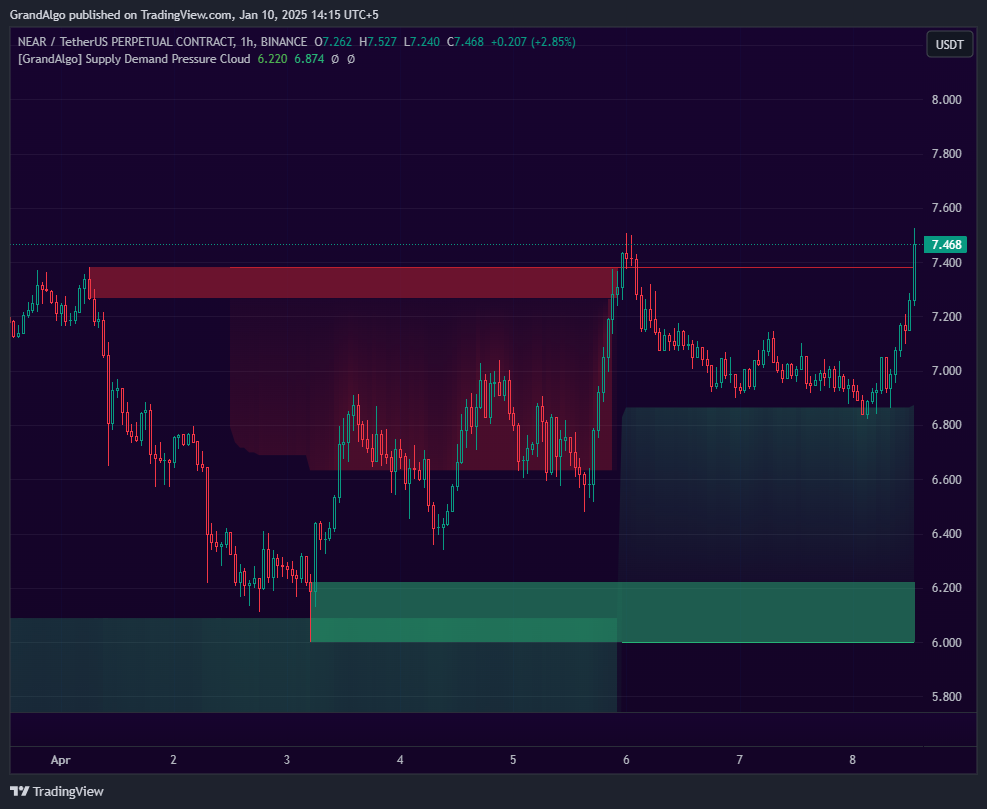
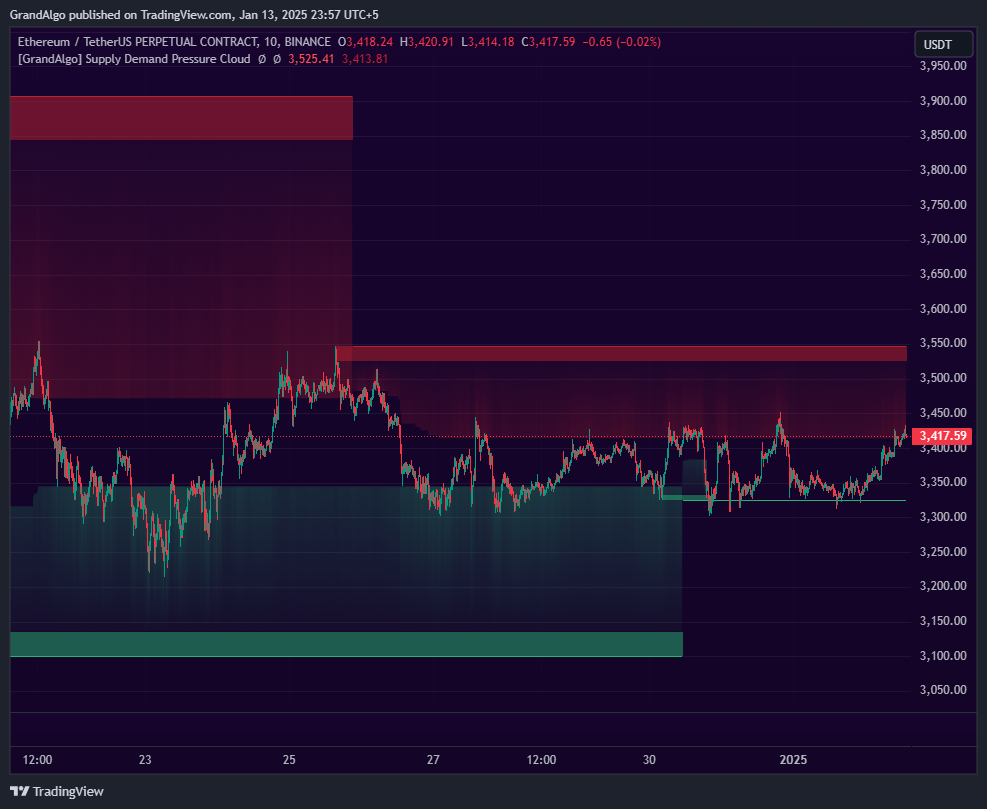
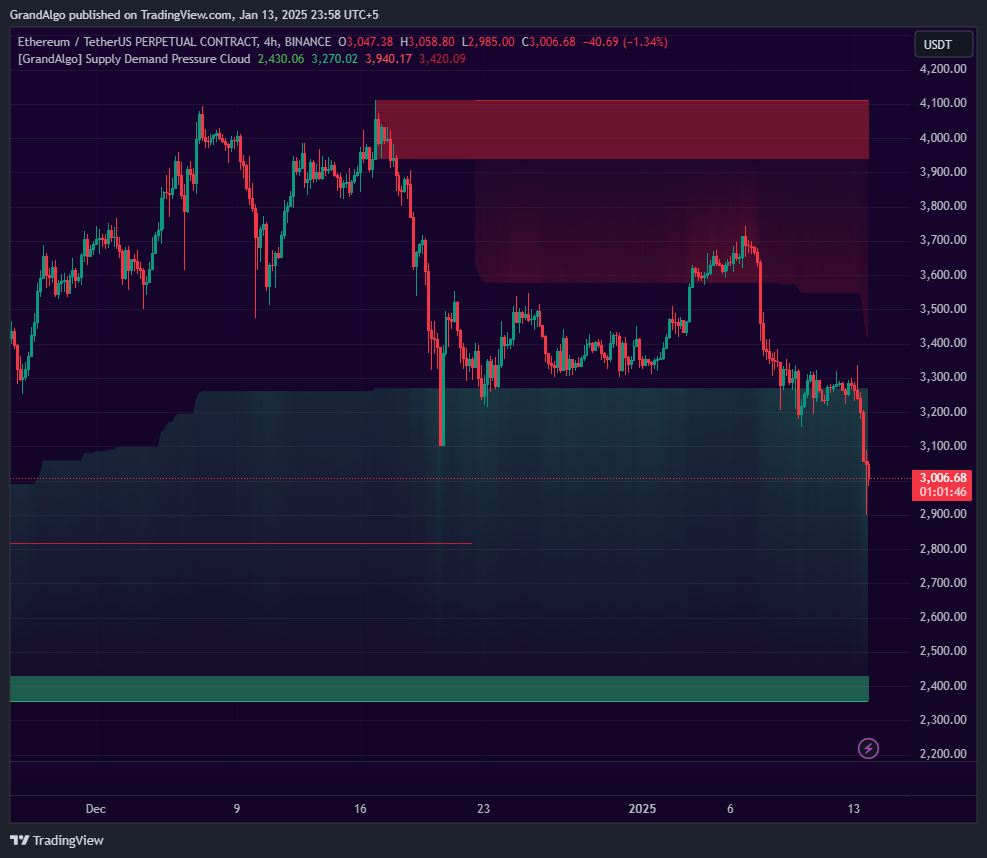
It overlays a gradient cloud on your chart, where:
This clean visual approach helps traders identify key price levels at a glance, reducing analysis time and improving trading efficiency.
Reversals often happen when price hits a supply or demand imbalance. The Strong Pressure Zone marks areas where large buy or sell orders are likely sitting, making them potential turning points.
When price reaches a Strong Supply Zone, sellers tend to step in, pushing price downward.
When price touches a Strong Demand Zone, buyers step in, causing price to rise.
By watching these high-pressure areas, traders can enter high-probability reversal trades with minimal risk.
Not every price move is a reversal. Sometimes price breaks through supply or demand levels and starts trending in one direction.
The Moderate and Mild Pressure Zones help traders anticipate these breakouts by showing where price is struggling or building momentum. If price moves gradually through these zones without rejection, it signals a higher chance of trend continuation.
The Supply Demand Pressure Cloud becomes even more effective when used alongside our proprietary indicators, providing a comprehensive view of market structure and liquidity.
By combining these tools, traders can filter out weaker signals and focus only on the highest-probability trade setups, leading to better decision-making and improved risk management.
One of the biggest challenges in trading is placing effective stop losses. Many traders set stops too close, causing premature exits. Others set them too far, increasing risk.
With the Pressure Cloud, traders can position stop losses just outside key pressure areas, ensuring they are not stopped out by minor fluctuations. This approach improves risk management and protects capital.
The Supply Demand Pressure Cloud works on any timeframe, making it useful for:
Its dynamic adjustments allow traders to use the same indicator effectively across multiple trading styles.
Short-term traders can use Strong Pressure Zones to time reversals and Moderate Pressure Zones to catch breakouts in fast-moving markets.
Swing traders can analyze how supply and demand zones evolve over time, helping them enter at the right moment and ride trends for larger profits.
Forex and crypto markets move based on institutional orders and liquidity shifts. The Pressure Cloud helps traders identify these shifts before they happen.
Stock and index traders can use the Pressure Cloud to track key supply and demand imbalances, aligning trades with major market movements.
Most indicators provide static support and resistance lines without considering market conditions. The Pressure Cloud dynamically updates based on live market action, offering real-time insights into how price interacts with supply and demand.
With multi-market compatibility, clear visual representation, and real-time adaptability, the Supply Demand Pressure Cloud is an essential tool for traders looking to refine their decision-making.
The Supply Demand Pressure Cloud is more than just another trading indicator. It is a powerful tool for understanding market imbalances, helping traders anticipate price reactions with greater confidence. Whether you are trading breakouts, reversals, or trend continuations, the Pressure Cloud gives you the clarity needed to stay ahead of market moves.
Upgrade your trading strategy with the Supply Demand Pressure Cloud and gain an edge in any market.
$59 /month
Flexible and affordable, our monthly plan is perfect for traders looking to test the waters and access premium tools without commitment.
$54 /month
Designed for serious traders, our quarterly plan offers enhanced value and extended access to our powerful trading solutions.
$49 /month
Maximize your savings with our yearly plan, providing uninterrupted access to all features for a full year at the best value.
Useful Links
Disclaimer: The tools and indicators provided by GrandAlgo.com are for educational purposes only and do not constitute financial advice. Trading involves significant risk, and past performance is not indicative of future results. Use at your own discretion.