


If you’ve ever wondered why price reacts sharply at certain levels, chances are you’ve stumbled across what’s known as an Institutional Price Block. These aren’t your everyday support and resistance levels—they’re zones where the biggest players in the market quietly enter and exit positions. By understanding how to spot these price blocks, retail traders can gain valuable insight into the mechanics driving market movements and align their strategies with institutional flows.
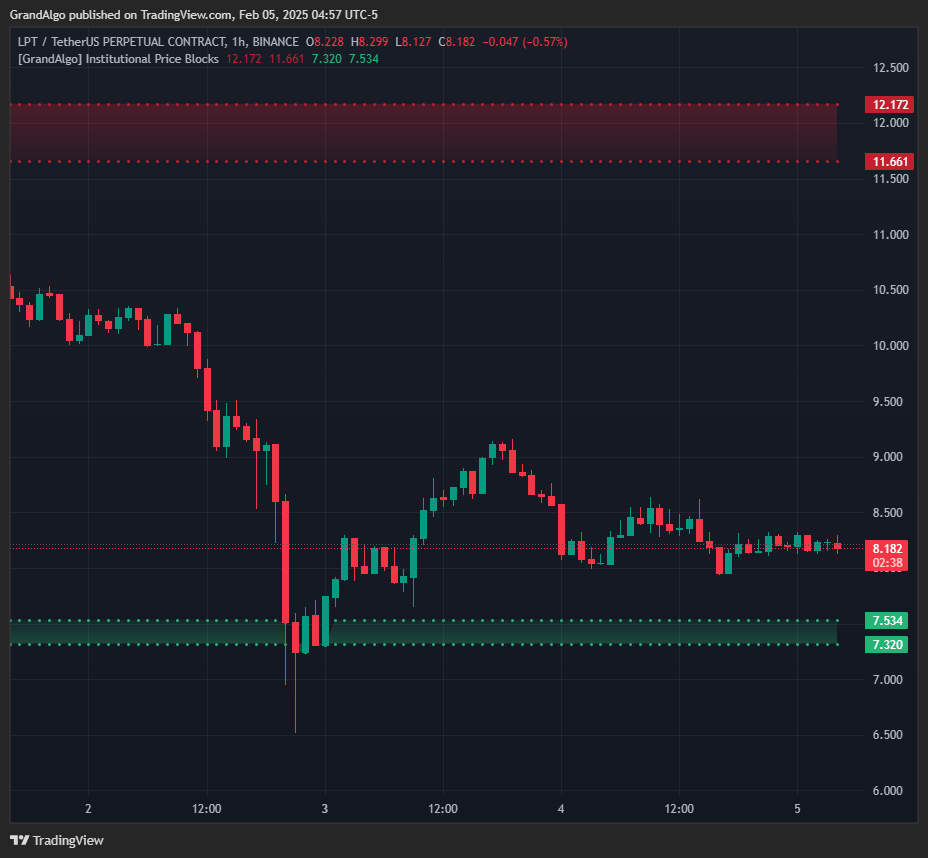
Institutional Price Blocks are specific price ranges where large financial institutions—like banks, hedge funds, and other major market players—execute their trades. Because institutions deal with massive order sizes, they can’t enter or exit the market in a single transaction without causing significant price fluctuations. Instead, they break up their trades across a range of prices, creating distinct price zones where their activity leaves a mark on the market.
These zones become significant because they represent areas of high interest for large players. When price revisits these zones, you often see strong reactions, as institutions may defend their positions or continue adding to them.
For retail traders, spotting institutional price blocks is like discovering the market’s hidden blueprint. Here’s why they’re essential:
High Probability Reaction Zones:
Price frequently reacts when it returns to an institutional price block. Whether it’s a reversal, a bounce, or even a quick breakout, these areas serve as hotspots for price movement.
Insight into Market Intentions:
Institutions typically operate with more data and resources than retail traders. Recognizing their price blocks gives you a glimpse into their strategies, allowing you to trade with the smart money instead of against it.
Improved Risk Management:
Trading around institutional price blocks provides clear zones for placing stop-losses and profit targets, leading to better risk-reward ratios.
Avoiding Common Traps:
Many fake breakouts and sudden reversals happen around institutional price levels. Understanding where these blocks are can help you steer clear of such traps.
While they may seem elusive, institutional price blocks often leave subtle clues on price charts. Here’s how you can spot them:
Sharp Price Movements from Consolidation Zones:
When price moves sideways within a defined range and then breaks out with strong momentum, the prior range often signals institutional activity.
Rapid Impulsive Moves:
Large institutions can cause sudden, strong price moves due to their trade size. These moves usually follow periods of accumulation or distribution within a specific price range.
Retests of Key Price Ranges:
After a strong move, price often returns to the same range for a retest. This is a classic sign that institutions are either defending their positions or completing their transactions.
Volume Clues:
Significant increases in volume within certain price ranges can be a sign of institutional involvement. Institutions need liquidity, and their activity often spikes trading volume in these zones.
Now that you can spot them, how do you incorporate institutional price blocks into your strategy? Here’s a step-by-step guide:
Identify the Price Block:
Look for price ranges where there was sideways movement followed by a strong directional breakout. Mark this zone on your chart.
Wait for a Retest:
Patience is key. Let the price come back to this zone. When it does, it’s your chance to look for an opportunity.
Look for Confirmation Signals:
Once price re-enters the block, watch for signals like shifts in momentum, rejection wicks, or reversal patterns to confirm the trade.
Set Your Trade Parameters:
Enter your trade after confirmation, place your stop-loss just outside the price block, and set your target based on recent highs, lows, or the next institutional price block.
Manage the Trade:
As the trade moves in your favor, adjust your stop-loss to lock in profits and reduce risk.
Let’s say you’re analyzing GBP/USD. You notice that the price hovered between 1.2500 and 1.2550 for a while before sharply rallying to 1.2700. That range between 1.2500 and 1.2550 is likely an institutional price block where large players accumulated positions.
Later, the price retraces to 1.2530. Instead of panicking or guessing, you recognize this as a potential revisit to the institutional block. You wait for price to show signs of rejection, enter a long trade, and place your stop just below 1.2500. As the price moves back toward 1.2700, you lock in profits along the way.
Misidentifying Ranges:
Not every consolidation is an institutional price block. Focus on ranges that are followed by strong, decisive price moves.
Entering Too Early:
Just because price revisits a block doesn’t mean it will react immediately. Always wait for confirmation before entering a trade.
Ignoring Market Context:
Institutional price blocks don’t exist in a vacuum. Consider overall market trends, news, and other factors when evaluating these zones.
Placing Stops Too Close:
Institutions can create volatility around these blocks to shake out weak hands. Give your trades enough room to breathe.
Institutional Price Blocks offer traders a powerful way to understand the hidden forces that move the market. By identifying these zones and aligning your trades with institutional activity, you can improve your trading accuracy and avoid common pitfalls that trap retail traders.
Trading isn’t about guessing—it’s about reading the market’s clues. And institutional price blocks are some of the clearest clues you’ll find.
$59 /month
Flexible and affordable, our monthly plan is perfect for traders looking to test the waters with a 7 days free trial and access powerful tools without commitment.
$54 /month
Designed for serious traders, our quarterly plan offers enhanced value and extended access to our powerful trading solutions.
$49 /month
Maximize your savings with our yearly plan, providing uninterrupted access to all features for a full year at the best value.
Useful Links
Disclaimer: The tools and indicators provided by GrandAlgo.com are for educational purposes only and do not constitute financial advice. Trading involves significant risk, and past performance is not indicative of future results. Use at your own discretion.