


Understanding where price gets stuck, accumulates, or faces rejection is key to successful trading. Many traders focus only on support and resistance, missing the deeper price action happening within Candle Trap Zones. This is where the Candle Trap Zone Indicator provides a significant edge.
By analyzing Candle Ranges, this tool highlights areas where price consolidates before a breakout or reversal. It identifies price zones where candles consistently get trapped, offering traders early signals of market moves. Whether you trade Forex, crypto, stocks, or commodities, recognizing Candle Trap Zones can refine your strategy and improve decision-making.
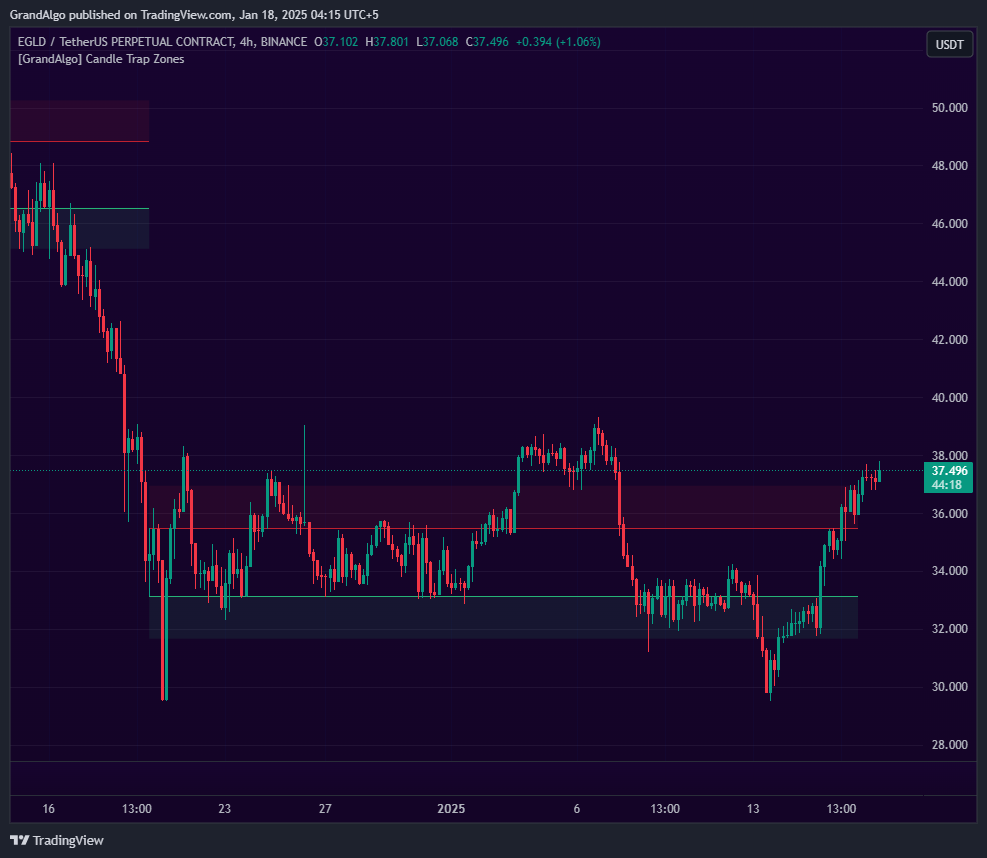
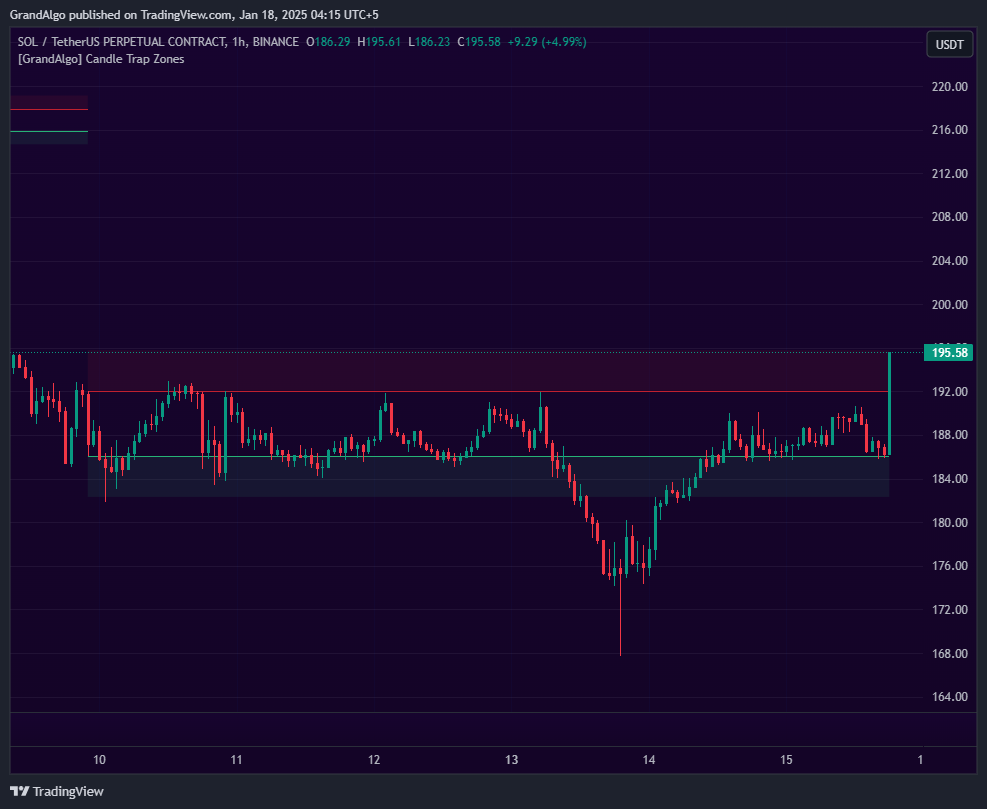
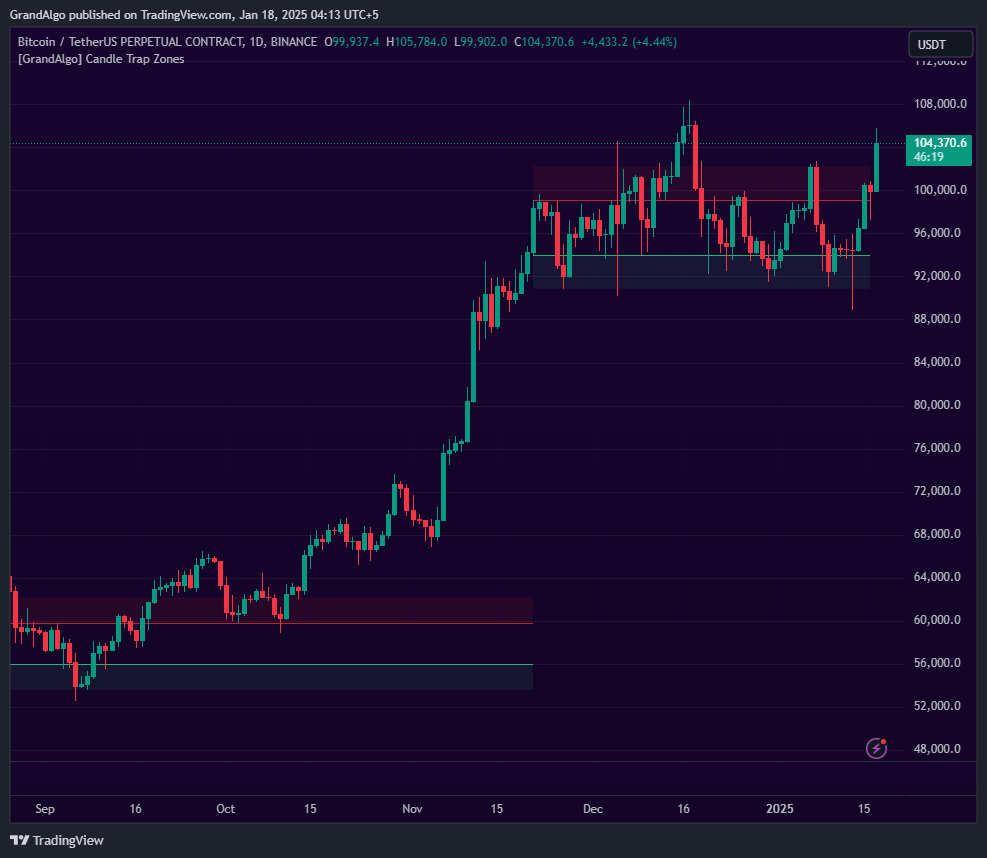
A Candle Trap Zone is a price range where multiple candles accumulate within a narrow band. These zones form when price experiences repeated rejection, signaling potential accumulation or indecision. They often lead to breakouts, reversals, or extended consolidations.
Think of a Candle Trap Zone as an area where the market pauses, gathers momentum, or tests price limits before making a decisive move. Spotting these zones early allows traders to position themselves ahead of major market shifts.
Most traders rely on support and resistance, trendlines, or moving averages, which often miss hidden price action signals. The Candle Trap Zone Indicator provides a deeper layer of analysis, helping traders focus on areas where price is likely to react.
Markets consolidate before large moves. Candle Trap Zones highlight these areas, giving traders an advantage by identifying breakouts early.
Price does not move in straight lines. It gets trapped, rejected, and retests key levels before reversing. The indicator identifies these zones before the move happens, improving trade timing.
In volatile markets, false signals are common. The Candle Trap Zone Indicator helps eliminate noise by showing only high-probability reaction areas.
Knowing where price is likely to react helps traders set more accurate stop-loss levels and manage risk effectively.
The indicator automatically identifies areas where a high percentage of candles are trapped within a specific Candle Range. This provides real-time market insights.
Beyond simple trap zone detection, the indicator overlays Fibonacci levels to highlight potential breakout and reversal targets.
Never miss a trading opportunity. The indicator sends instant notifications when price enters, exits, or re-enters a Candle Trap Zone.
When price re-enters a trap zone, the indicator dynamically extends the area, keeping your analysis up-to-date.
Traders can adjust the Candle Range detection to match their trading style, whether they are scalping or swing trading.
When price consolidates inside a Candle Trap Zone, watch for a breakout above or below. The Fibonacci Cloud provides natural price targets.
If price touches a trap zone and shows rejection signs like long wicks or engulfing candles, a reversal may be imminent. This is even stronger when it aligns with key support or resistance.
Use Fibonacci levels and price touch points to fine-tune trade timing. If price touches an upper Fibonacci level and shows rejection, it might be time to exit or tighten stop-losses.
Markets move fast. Real-time alerts ensure traders never miss an opportunity.
Whether you scalp short-term moves or swing trade larger trends, the Candle Trap Zone Indicator adapts to fit any strategy.
The Candle Trap Zone Indicator works best when paired with Reversal Market Structure. By analyzing higher highs, lower lows, and trend shifts, traders can confirm whether price will react inside a Candle Trap Zone.
For example, if a trap zone aligns with a lower high in a downtrend, it increases the likelihood of rejection. When combined, Reversal Market Structure and Candle Trap Zones create stronger trade confirmations.
Short-term traders need precision. Candle Trap Zones help identify high-probability breakout and reversal setups.
Swing traders can use Candle Trap Zones to spot accumulation areas and plan trades with a longer-term perspective.
False breakouts are common in Forex and crypto markets. The Candle Trap Zone Indicator filters out weak signals to improve trade accuracy.
Even in strong trends, price pauses, consolidates, or retraces. Recognizing Candle Trap Zones helps traders manage trend entries and exits.
Traditional indicators like moving averages and RSI rely on lagging data. They confirm moves after they happen, causing traders to miss early opportunities.
The Candle Trap Zone Indicator is different. It focuses on real-time price action, allowing traders to react faster and enter before big moves. Combined with Fibonacci analysis and real-time alerts, it provides a complete approach to trading market consolidations.
The Candle Trap Zone Indicator is not just another trading tool. It is a powerful market analysis system that helps traders identify price accumulation, anticipate breakouts, and improve risk management.
When paired with Reversal Market Structure, it creates stronger confirmations for high-probability setups. Whether you are a beginner or an experienced trader, this indicator gives you the clarity and confidence to trade more effectively.
Start trading with real-time price action insights using Candle Trap Zones today.
$59 /month
Flexible and affordable, our monthly plan is perfect for traders looking to test the waters and access premium tools without commitment.
$54 /month
Designed for serious traders, our quarterly plan offers enhanced value and extended access to our powerful trading solutions.
$49 /month
Maximize your savings with our yearly plan, providing uninterrupted access to all features for a full year at the best value.
Useful Links
Disclaimer: The tools and indicators provided by GrandAlgo.com are for educational purposes only and do not constitute financial advice. Trading involves significant risk, and past performance is not indicative of future results. Use at your own discretion.