


Ever wonder why the price bounces off certain levels or suddenly breaks out with no warning? It’s not magic—it’s liquidity. The Liquidity Heatmap pulls back the curtain on those hidden buy and sell zones that actually drive the market. Instead of guessing, you’ll have a live, visual map showing where price is likely to react. Think of it as your unfair advantage.
A Liquidity Heatmap isn’t just another fancy indicator—it’s more like market X-ray vision. It highlights the zones on your chart where major buy and sell orders are stacked. These zones are like magnets for price action. You might’ve heard people talk about support and resistance, but liquidity zones take that idea a step further. They show you where real market activity is brewing, not just historical levels.
And the best part? You don’t need to be a quant or dig through complicated order books to use it. The heatmap makes it visual, intuitive, and easy to read right off your chart.
Let’s get real: price doesn’t just move randomly. It’s drawn to liquidity. Think of liquidity zones as the places where the market likes to “hang out.” These are areas where big players—institutions, hedge funds, and whales—have loaded up on orders. And when the price hits these zones? That’s when you see reactions: sharp reversals, breakouts, or sudden consolidations.
If you’ve been trading without considering liquidity, you’re missing a massive part of the picture. You might be relying on indicators or patterns that only tell half the story. The Liquidity Heatmap fills in those gaps, giving you insights most traders don’t have.
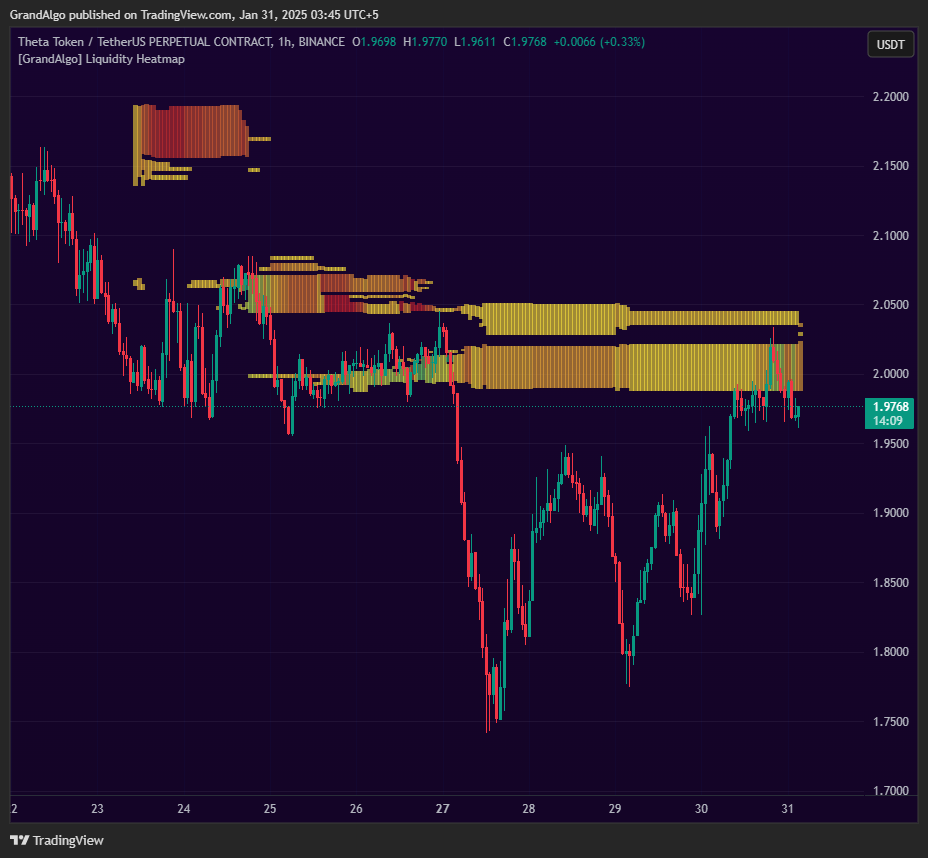
Visual Liquidity Mapping:
Instead of staring at numbers in an order book, the heatmap lays out liquidity zones right on your chart. It’s like turning invisible market data into something you can see.
Real-Time Market Insights:
Markets move fast, and this tool moves with them. It updates automatically, giving you the freshest look at where buy and sell pressure is stacking up.
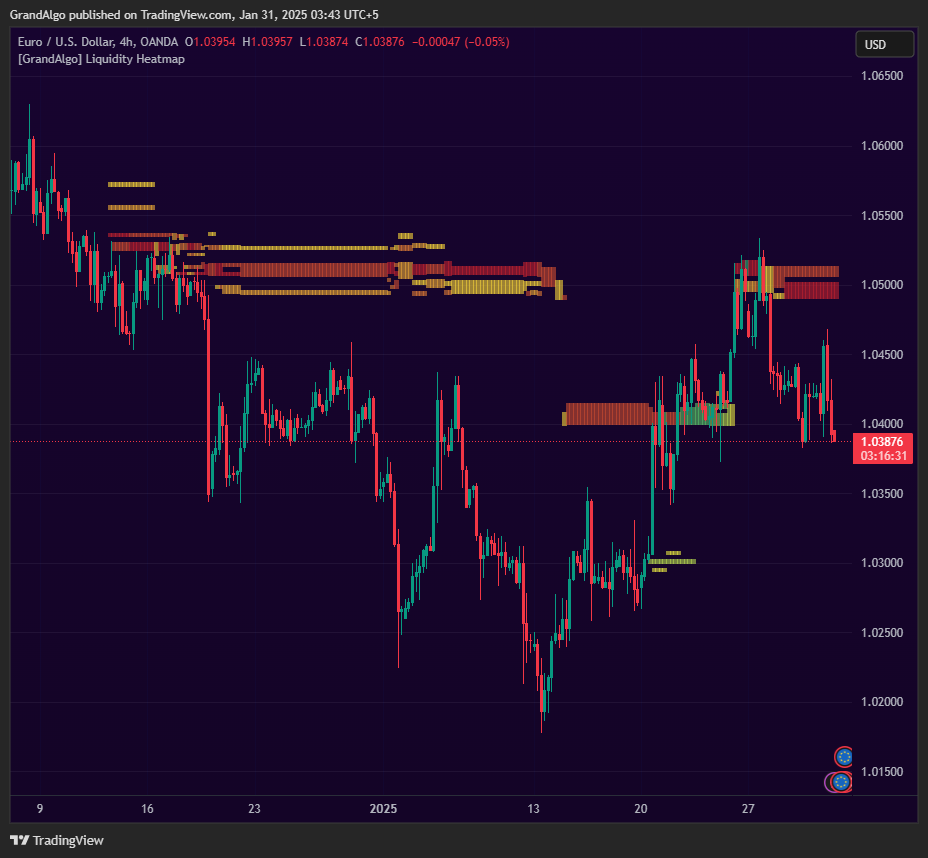
Works Across All Markets:
Forex, crypto, stocks, indices—you name it. No matter what you’re trading, the Liquidity Heatmap adapts to your market and timeframe.
Spot Key Support and Resistance Levels:
Liquidity clusters aren’t just random zones—they often line up with areas where price reacts the most. The heatmap helps you see these zones before the price gets there.
Sharper Trade Execution:
When you know where liquidity is, you can time your entries, exits, and stop-losses with more precision. No more random guesses—just smarter, more informed trades.
Predict Price Reactions:
Liquidity zones act like magnets, pulling price toward them. By identifying these areas early, you can anticipate where price might bounce, stall, or break out.
Validate Your Setups:
Got a breakout strategy? Check the heatmap first. If there’s a big liquidity gap ahead, you’ve got extra confirmation. If there’s a wall of orders in your way, maybe rethink that trade.
Avoid Getting Caught in Fakeouts:
Fakeouts are the bane of every trader’s existence. But with a liquidity heatmap, you can spot potential traps by seeing where the real orders are.
Better Risk Management:
Placing stops in obvious liquidity zones? That’s a recipe for getting stopped out early. The heatmap helps you avoid those traps, placing stops where they’re less likely to get hit.
Day Traders:
For quick trades, timing is everything. The heatmap helps you pinpoint the best entry and exit points, so you’re not left chasing price.
Swing Traders:
Trading over longer timeframes? Liquidity heatmaps help you find major zones where price might react, giving you a better roadmap for your trades.
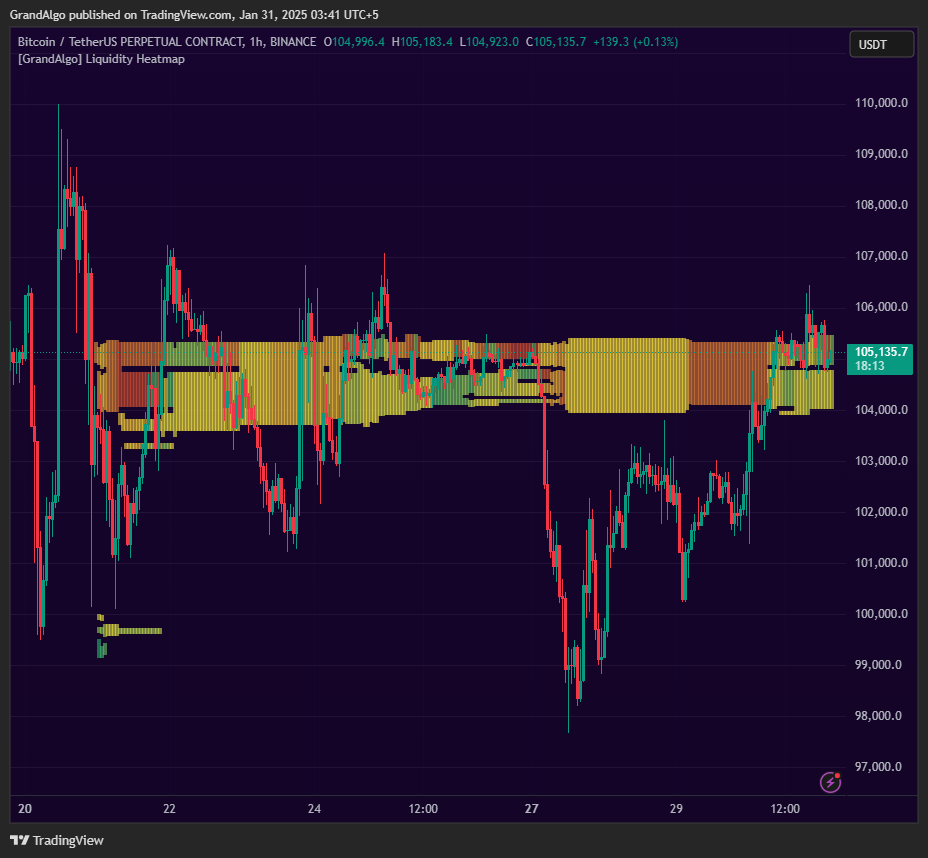
Crypto Traders:
Crypto markets are notoriously volatile, and liquidity can vanish in seconds. This tool helps you navigate those wild swings with more confidence.
Anyone Who’s Tired of Guessing:
Let’s be honest—guesswork has no place in serious trading. If you’re done relying on luck and want to understand what’s really moving the market, this tool’s for you.
Sure, moving averages, RSI, and MACD have their place. But here’s the problem—they’re all based on what’s already happened. They’re lagging indicators. A Liquidity Heatmap, on the other hand, gives you real-time insights into what’s happening right now. It’s not about replacing your current tools—it’s about adding another layer of clarity to your trading decisions.
Trading without understanding liquidity is like trying to drive blindfolded. The Liquidity Heatmap lifts that blindfold, showing you exactly where the action is. Whether you’re trading breakouts, hunting reversals, or just trying to stay ahead of the curve, this tool gives you the insights you need to make smarter, more confident trades.
Stop trading in the dark. Start seeing where the real opportunities are.
$59 /month
Flexible and affordable, our monthly plan is perfect for traders looking to test the waters with a 7 days free trial and access powerful tools without commitment.
$54 /month
Designed for serious traders, our quarterly plan offers enhanced value and extended access to our powerful trading solutions.
$49 /month
Maximize your savings with our yearly plan, providing uninterrupted access to all features for a full year at the best value.
Useful Links
Disclaimer: The tools and indicators provided by GrandAlgo.com are for educational purposes only and do not constitute financial advice. Trading involves significant risk, and past performance is not indicative of future results. Use at your own discretion.